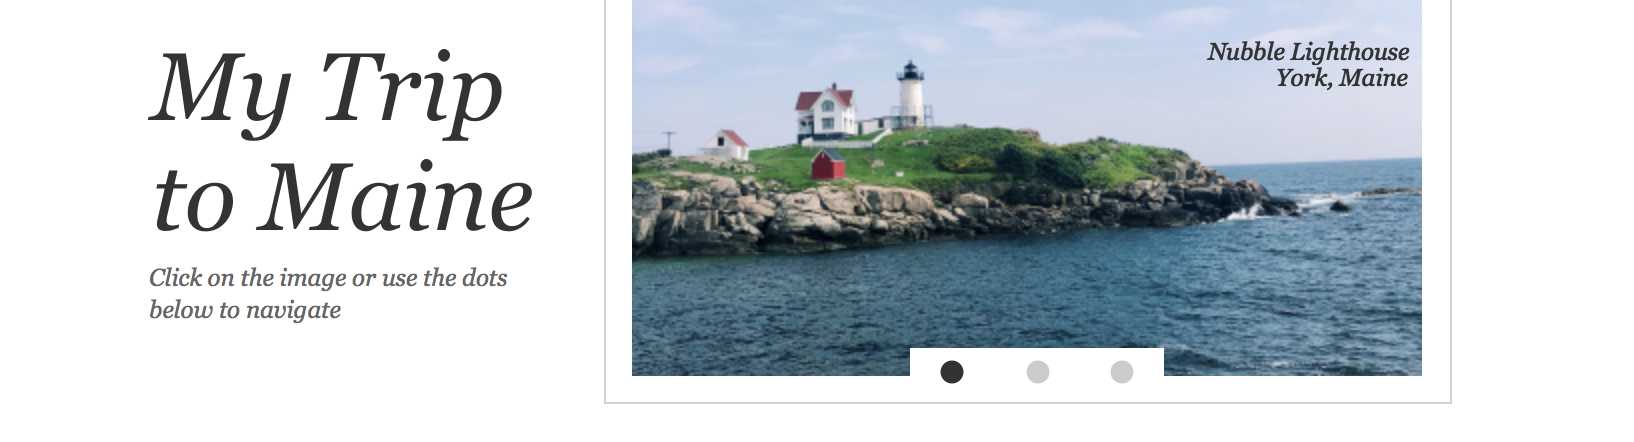
Image sliders or carousels are common features on webpages. Using Tableau set actions, transparent worksheets, and background map images, it is possible to cycle through a set of images. Clicking on one image brings up the next. Once the last image is shown, clicking on it automatically takes you back to the first. Navigation can be done either through clicking on the image or by using the dots (although, the dot navigation works perfect on desktop but not on public). This methodology does not have to apply to only images but can also be used for shapes or text.
The basic concept of incrementing comes from Joshua Milligan’s awesome post about Never Ending Navigation. I modified it to work with set actions instead of filter actions. Rotating through images could also be done using filter actions instead of set actions. However, using set actions allows for the ability to color the dot corresponding to which image you are on be a different color than the others.
How To
- Determine how many images you want to display. For this example, I am choosing 3.
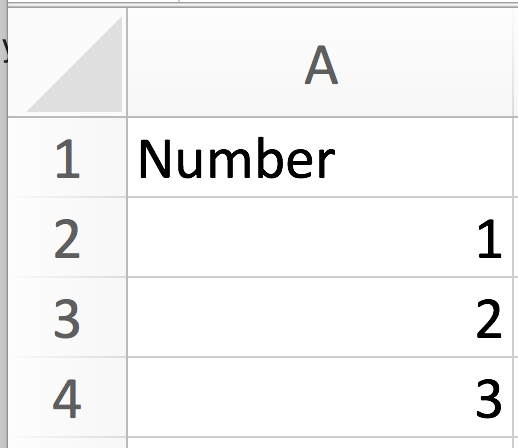
- Create a new one column spreadsheet. Call the column “Number” then type 1 in the row, 2 in the second row, etc. until you reach the number of images you want to display
- Add the new dataset into Tableau. Create a new worksheet called image.
- Create a new set based off of number. To do this, right click on number in the dimension shelf and select create > set. Name the set Image Set and click OK.
- Create a new calculation called image swap. Replace “3” on the first line with the number of images you have.
IF {MIN(if [Image Set] then [Number] END)}=3 AND [Number]=1
THEN "show"
ELSEIF [Number] = {MIN(if [Image Set] then [Number]+1 END)}
THEN "show"
ELSE "hide"
END
What is this calculation doing? this is the logic to swap the images. When we click on the displayed image, say image 1, we want it to then show image 2. When we click on image 2, we want it to then show image 3. When we click on image 3 we want it to then go back to image 1. The first part of the calculation says what number is in the set? Wrapping that in a LOD allows us to access that value on every row. If the image in the set is equal to 3, the last image in the set, then only show rows where number is equal to 1 (this is the piece to go from last to first). If the last image isn’t selected, then only show rows where the number is equal to the number in the set+ 1.
In this illustration of the calculation, clicking on the number 1 row updates the image swap value from “show” to “hide”. Then the number 2 row switches from “hide” to “show”.
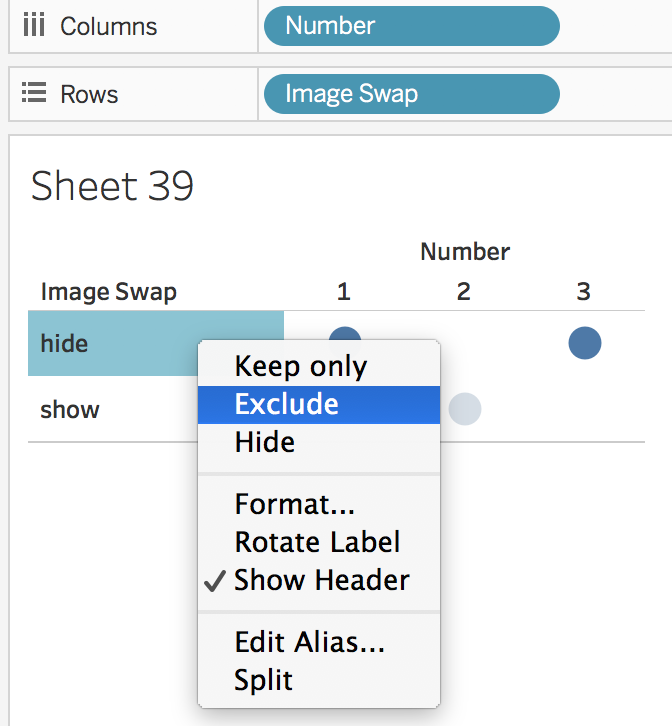
- Add number to columns and image swap to rows. Change the mark to circle.
- Right click on the image swap value of “hide” and select exclude
- Create a new dashboard and add the created worksheet to it
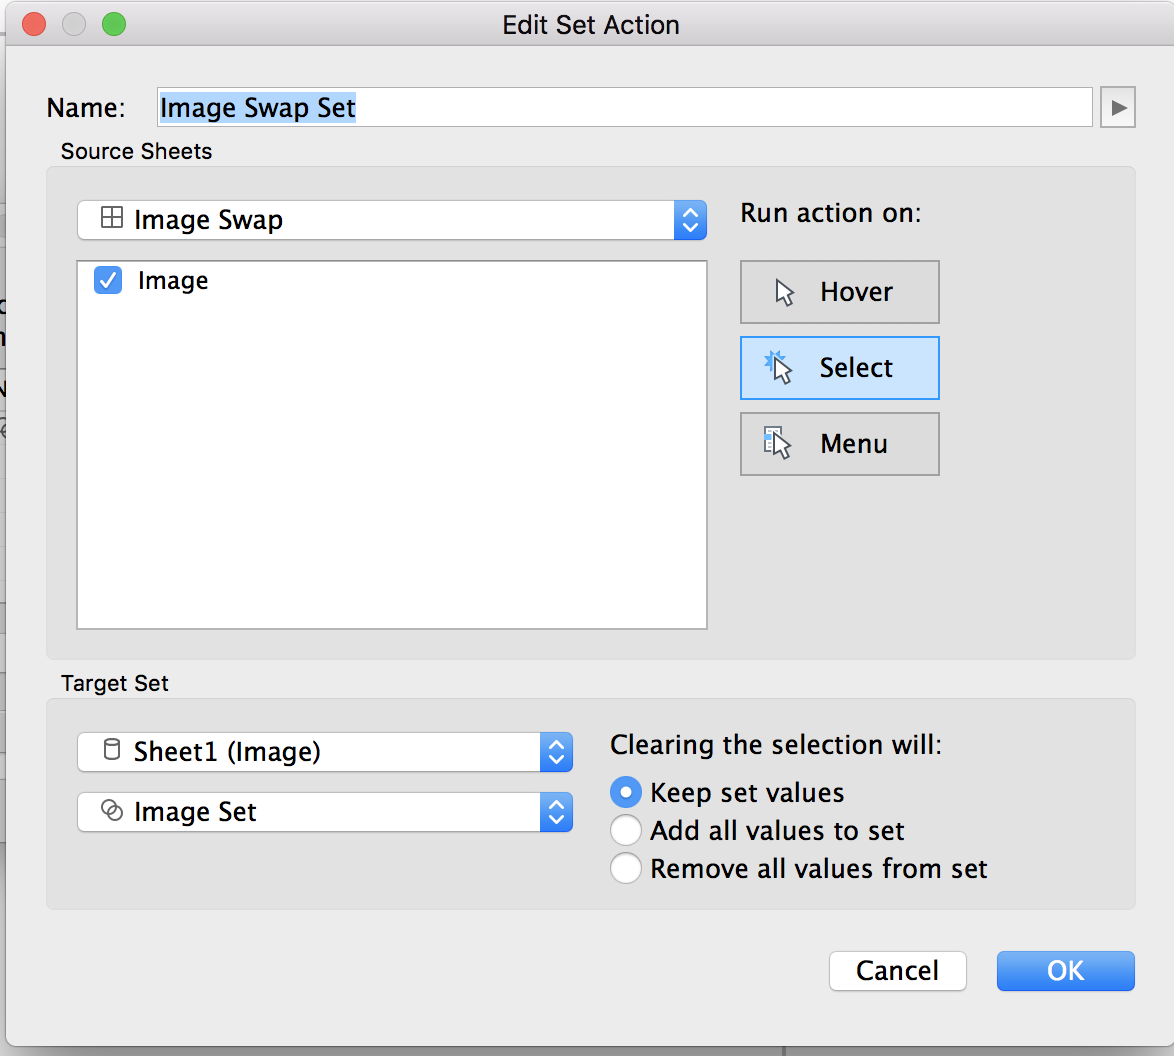
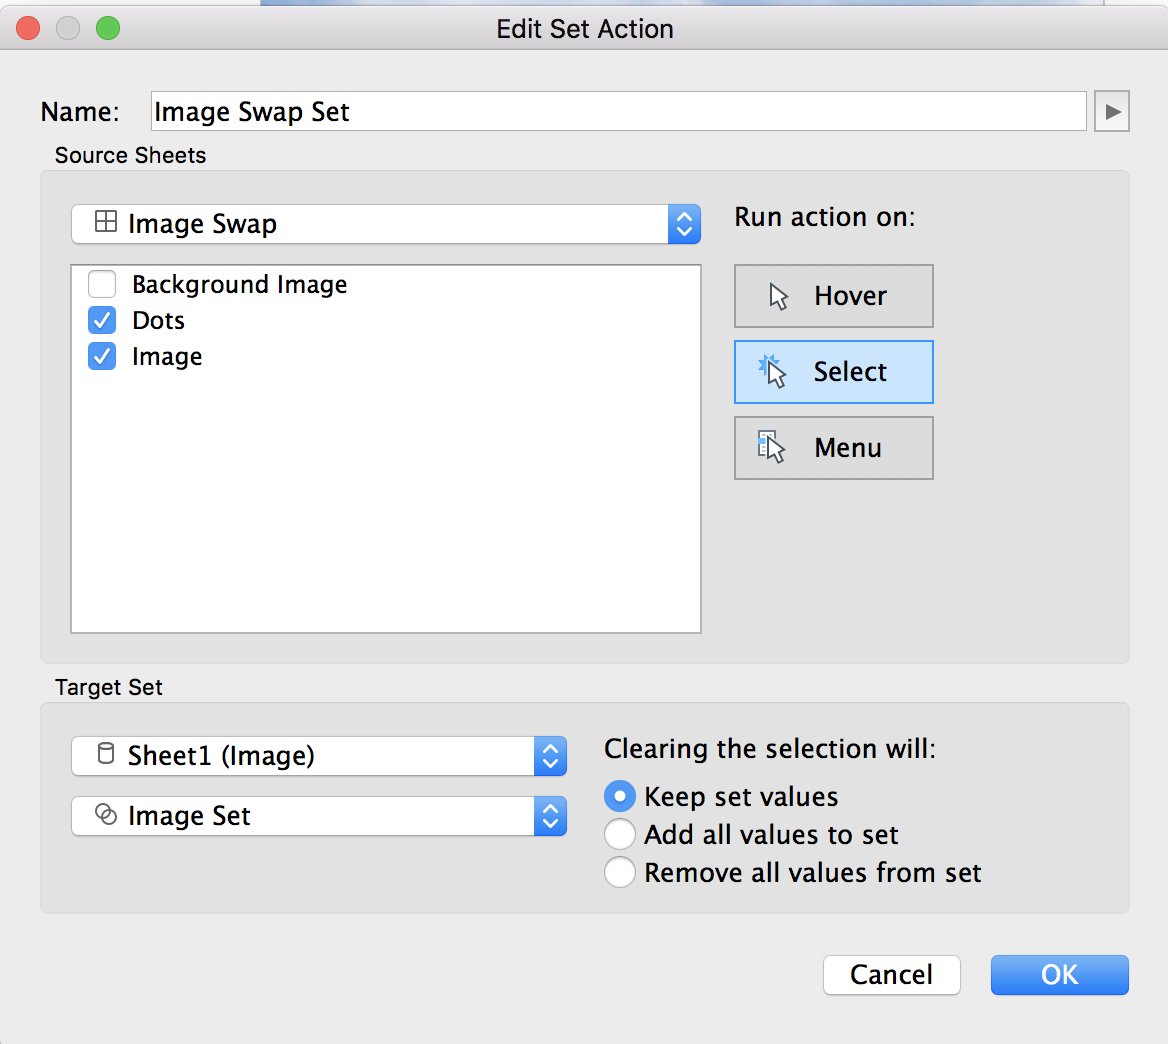
- Add a new set action. This can be done by going to dashboard > actions > add action > change set values. Run the action on select, with clearing the selection keeping set values.
- Test it out! Clicking on the circle should rotate the number above.
- Now, it’s time to add the images! One option is to upload your images into the custom shapes folder and then change the mark to shape to assign the images to each number. However, custom shapes are meant for smaller sizes and will most likely distort your images / make them look low quality. Therefore, we are going to use background images instead.
- Create a new worksheet called background images.
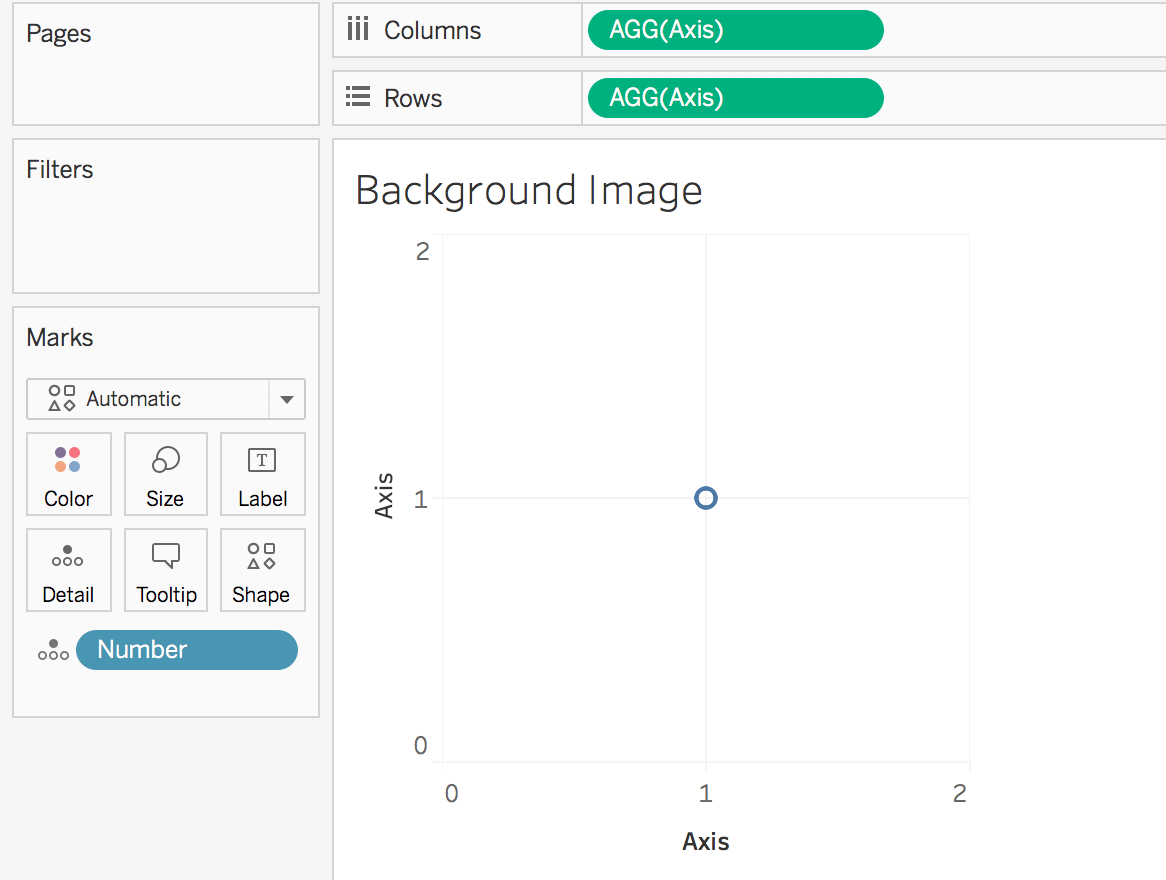
- Create a new calculation called axis
MIN(1)
- Add axis to the rows and columns shelf. Add number to the detail shelf.
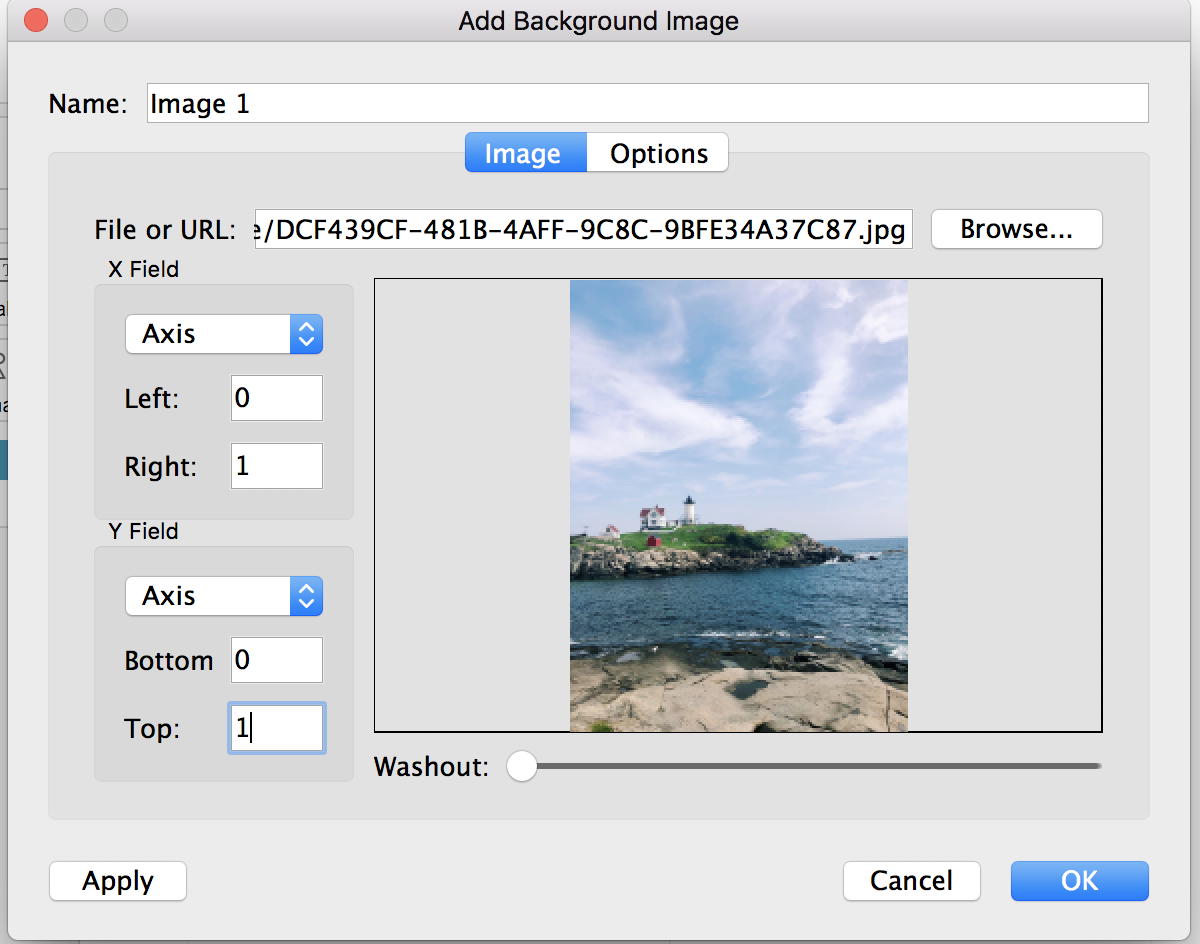
- Go to map > background images and select the name of the image data source. Select add image.
- Name it Image 1
- Browse for the image of your choosing
- Set the X field and Y field to axis. Change the right and bottom value to 1.
- Go to the options tab. Select always show entire image
- Select “add” on only show when. Select a field of number and select a value of 1
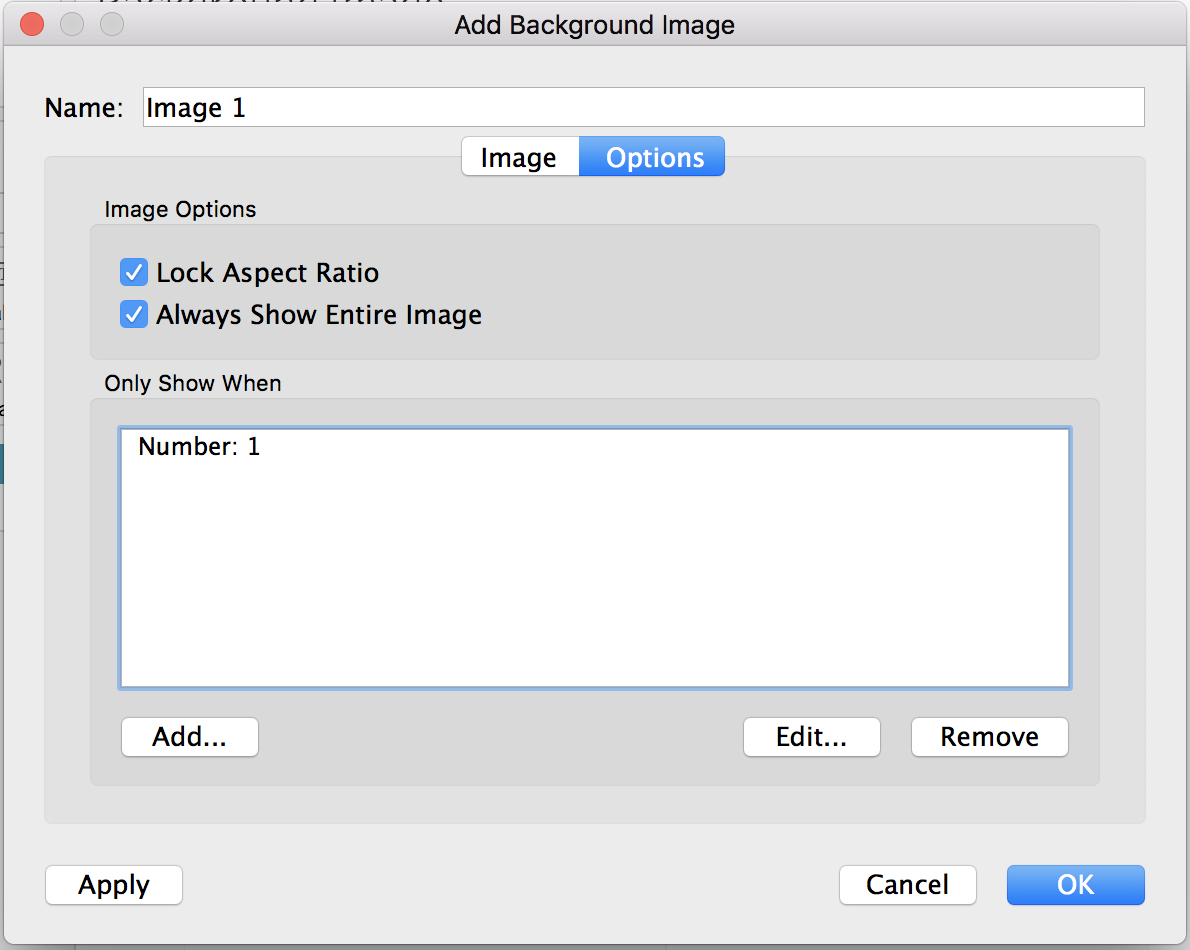
- Click OK
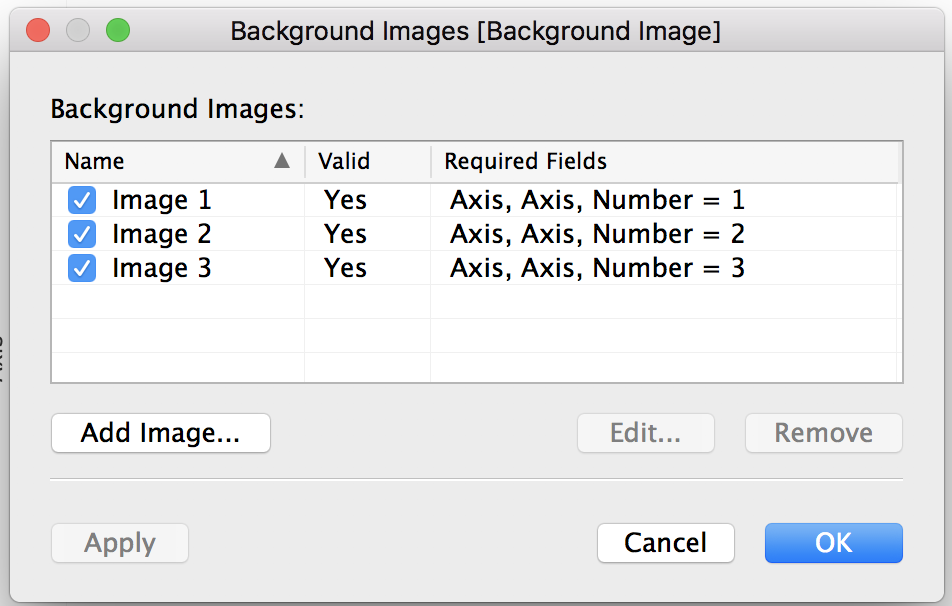
- Add two more images. Follow the exact same steps except name the new images “Image 2” and “Image 3”, select the corresponding images, and only show image 2 on number 2 and only show image 3 on number 3
- Edit both the X and Y axis to be a fixed range from 0 to 1. Then right click on both axis and unselect show header.
- Change the mark to circle. Change the opacity down 0% and the size to the smallest possible option.
- Go to map > map options. Uncheck both allow pan and zoom and show view toolbar.
- Add image swap to the rows shelf. Then, right click on hide and select exclude.
- Click on the image swap pill on the rows shelf unselect show header.
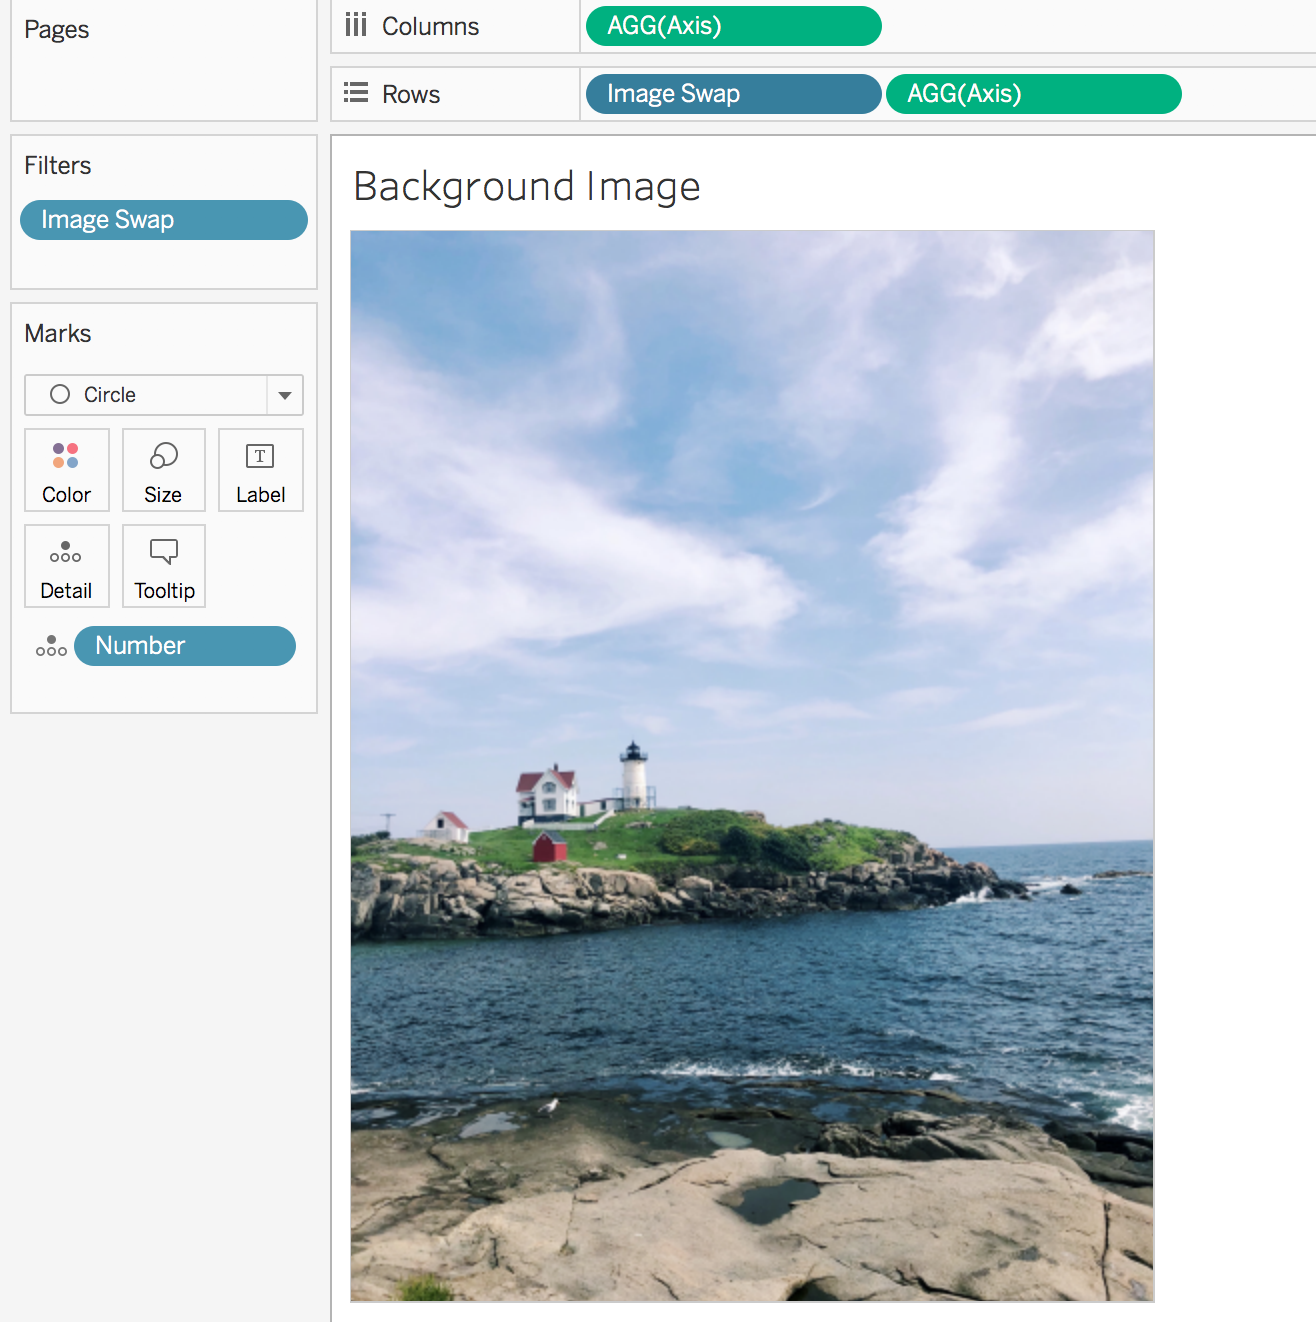
- Add the background image worksheet to the dashboard. For best luck sizing, leave the fit at standard. Click on the circle on the other worksheet and watch the image change! Now, if you wanted to update the shape from a circle to a right pointing arrow, you could allow the user to navigate that way! For this tutorial, we want the user to click on the image.
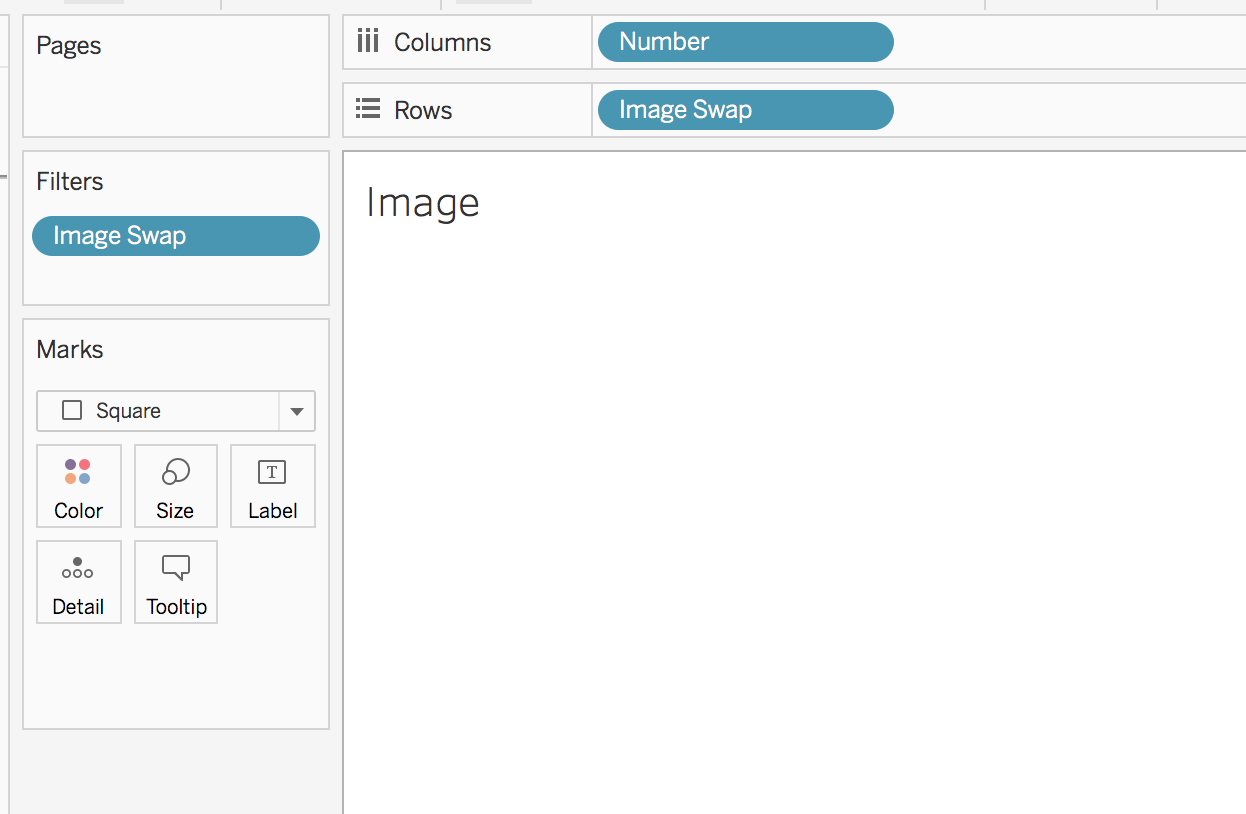
- Go to the image worksheet. Change the mark from circle to square. Update the size to be the largest possible. Change the color to white, with 100% opacity. Click on the image swap pill and uncheck show header. Click on the image pill and uncheck show header. Format the worksheet and change row dividers to none. It should now look like you have a blank worksheet!
- Go back to the dashboard. Update the image worksheet to have a fit of entire view and hide the title. Then change the floating order to front.
- Right click on the image worksheet and select format. Go to the shading tab and change the worksheet background from white to none. Then, place the image worksheet on top of the background image worksheet.
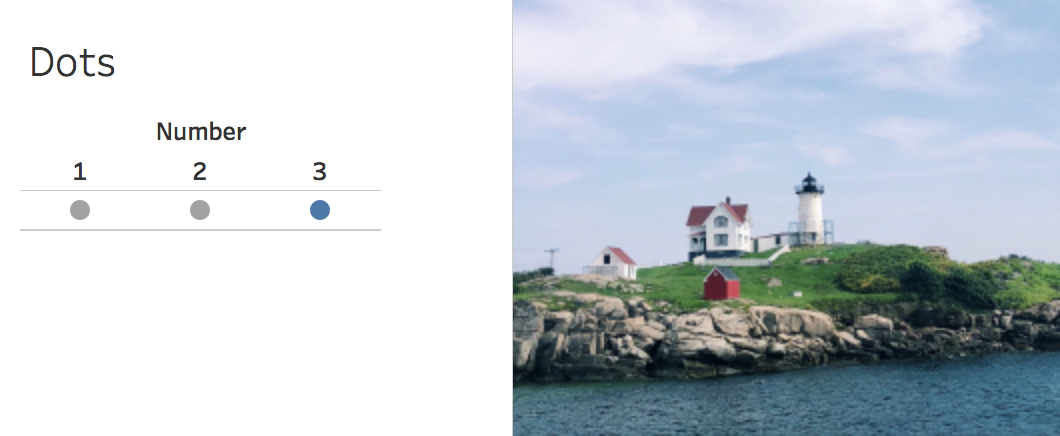
- Create a new worksheet called dots. Add number to the rows shelf. Change the mark type to circle.
- Add image set to the color mark.
- Right now my “image 1” is shown but on the dots worksheet the third dot is selected. Because of our image swap selecting offsetting by 1, we also need to offset the dots worksheet.
Click on the number pill on the columns shelf and select sort. Change the sort by to manual sort. Move 3 (or the highest number in your dataset) to the very top.

- Click on the number pill and unselect show header. Right click on the worksheet and select format. Go to the borders section and change row dividers to none.
- Add image swap to the detail mark. This will make it smoother if the user clicks on the dots to navigate!
- Add the dots worksheet to the dashboard.
- Update the set action. This can be done by going to dashboard > actions. Edit the image set action. Check “dots” as one of the source sheets
- Test it out! You cannot navigate by clicking on the image or by using the dots!
To view my working example on Tableau Public or to download my workbook, click here. Also, check out the other dashboards in the workbook detailing different ways to use set actions.