Category: Blog

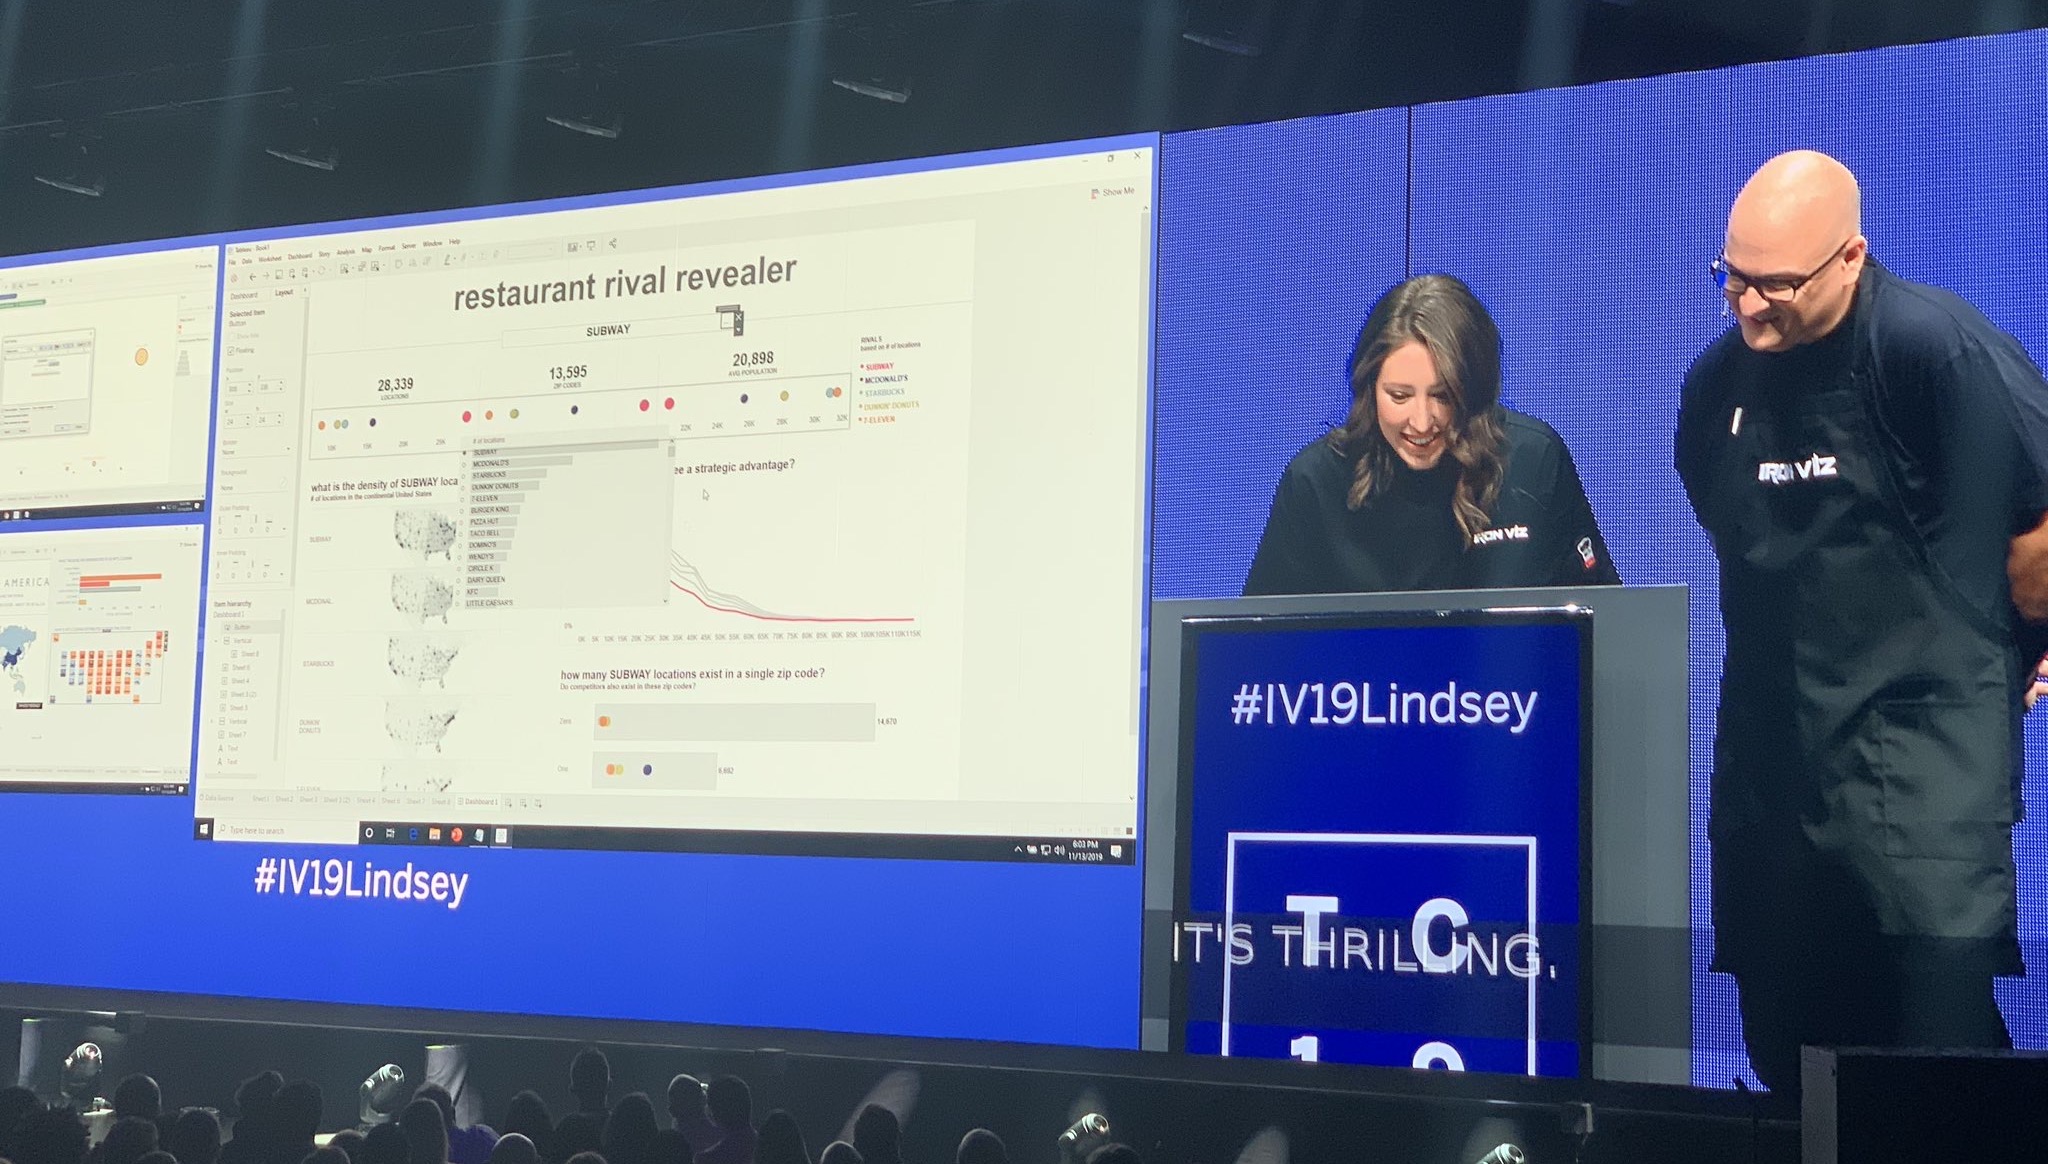
If I were to give an acceptance speech, à la Tony’s, for winning the second Iron Viz feeder of 2019, it would go something like this: I was not expecting to win, the creativity and quality of the other entries was astounding. IronViz showcases the best work the data visualization community has to offer and […]

In a previous post, I wrote about how to create a custom dropdown using parameter actions and show/hide container buttons, as seen in my IronViz. However, I got to thinking, the list of values that appears is LONG. Having them sorted greatest to least by number of locations certainly helps, but what if there is […]

It took me five years to work up the courage to enter a feeder for Iron Viz. I never thought I would win, but the small possibility of winning was enough to keep me away. I knew technically speaking I could build a viz in 20 minutes, but the idea of having to present it […]

In my 2019 Tableau Iron Viz entry, I wanted the end user to be able to select a brand to understand its particular location strategy. I also wanted the ability to compare the selected brand to its rivals. The best way to achieve this was through using a parameter. However, the dataset included 922 unique […]
My 2018: A Hand-Drawn Data Viz

2018 has been quite the year for me personally and professionally. In May I accepted a remote Tableau developer position with one goal in mind: travel to different cities and decide where I wanted to move to. I fell in love with New York City and am planning on moving there in January (and as you can […]

Special thanks to Justin Davis, Michael Sandberg, Ryan Hall, Mark Bradbourne, and Matt Chambers. Set actions, released in Tableau 2018.3, are one of the most powerful new Tableau features since Level of Detail (LOD) expressions. Prior to their release, I had never used sets before. So, it took me a while to wrap my head […]

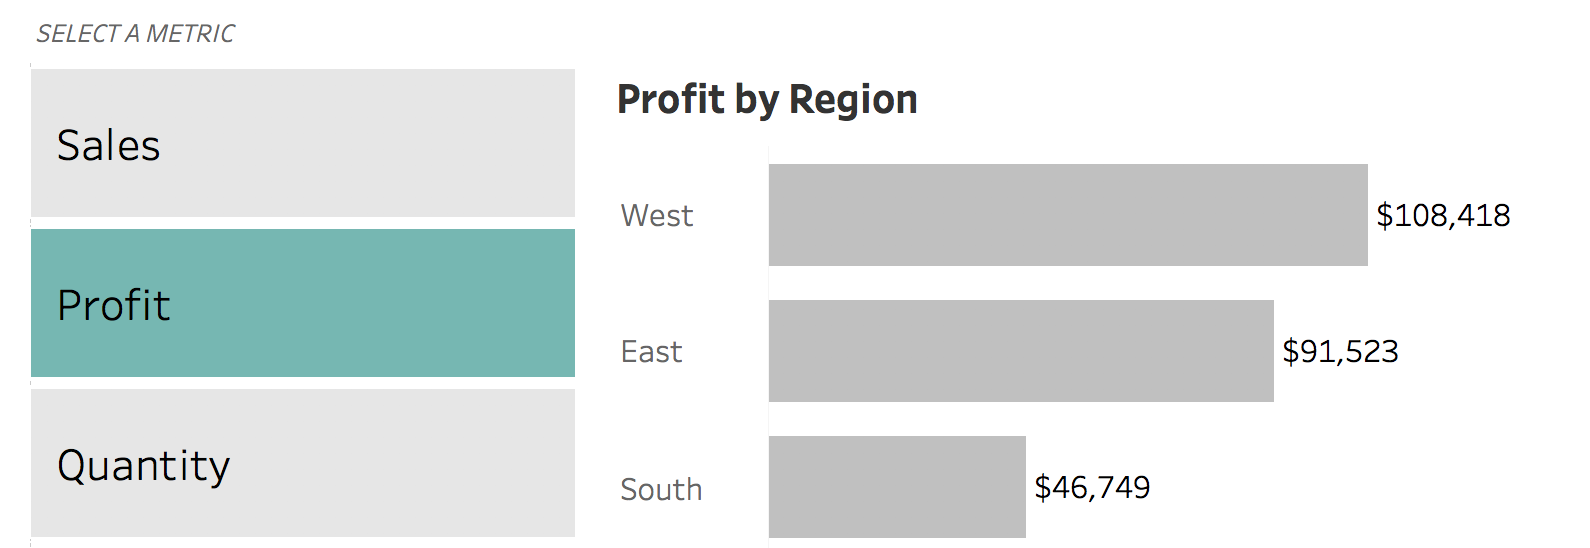
I previously wrote about how to change dimensions using set actions. However, I have since found a better, easier way that can work for metrics OR dimensions. Previously, you had to unselect a value before selecting the next. This method does not require that! This can be extended even further to add text for additional insight or […]

Image sliders or carousels are common features on webpages. Using Tableau set actions, transparent worksheets, and background map images, it is possible to cycle through a set of images. Clicking on one image brings up the next. Once the last image is shown, clicking on it automatically takes you back to the first. Navigation can be […]

In Tableau, to add multiple values from a table or any visualization to a set action, the user has to hold down command (on a Mac, control on a PC) while clicking all the options they want. But what if you want the control the number of items a user can select? Or you don’t […]