The What
Set actions can be used to dynamically update reference lines and mark coloring upon clicking a point on a trend line.
The Inspiration
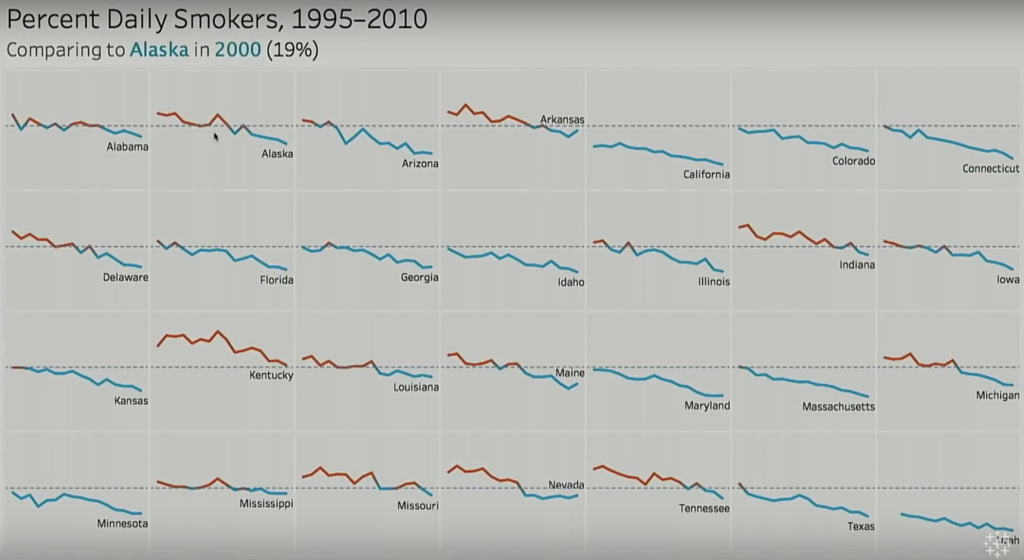
During the 2018 Tableau Conference Devs on Stage session, Set Actions and Parameter Actions were announced. The example for parameter actions involved looking at a trend line (by year) for each state. Hovering over any point on the trend line (ex: Alaska in 2000) would then take that value and place it as a reference line on every state. Then, any value below the dynamic reference line is blue and any value above the reference line is orange. Since parameter actions are not available currently, I wanted to see if I could recreate in using set actions.
The How
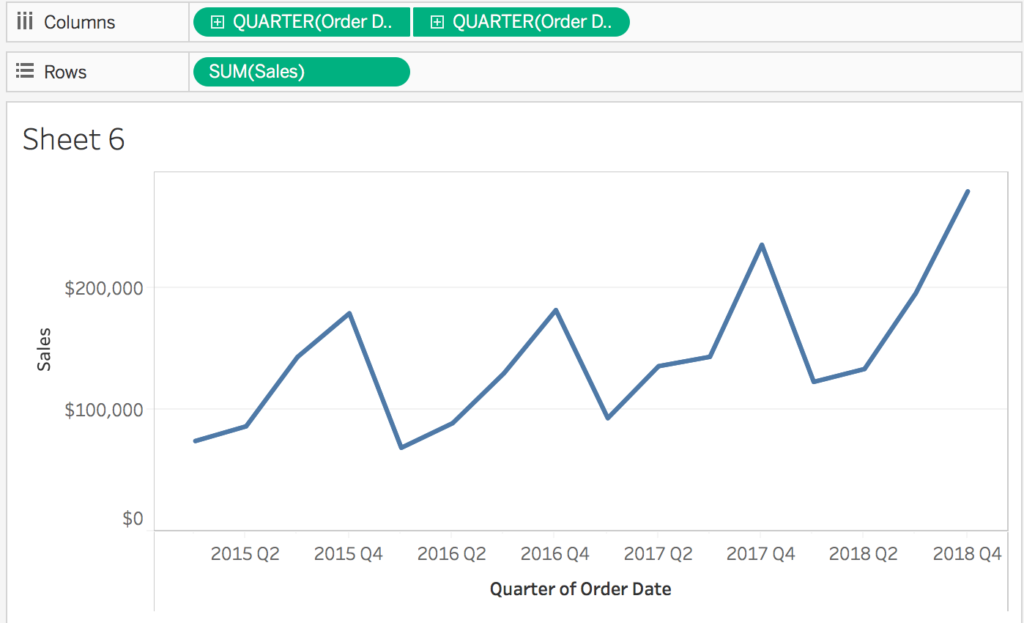
- Add “Order Date” to the columns shelf as continuous, quarter date value (the Q2 2015 option). Add sales to the rows shelf.
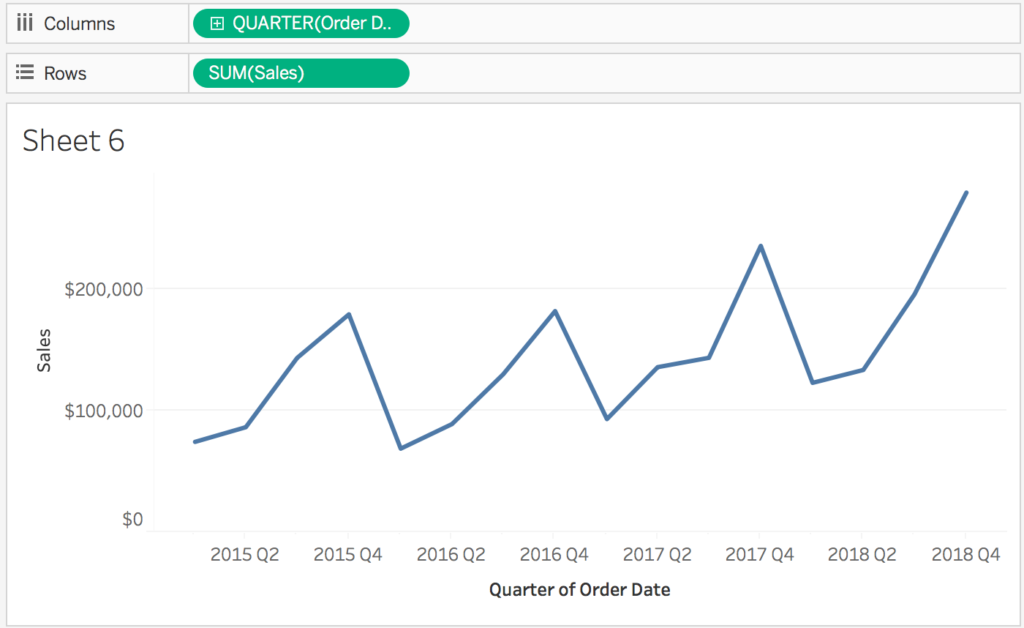
- Duplicate the “Order Date” pill on the columns shelf. Right click on the pill and select “dual axis”. Right click on the date axis and uncheck show header.
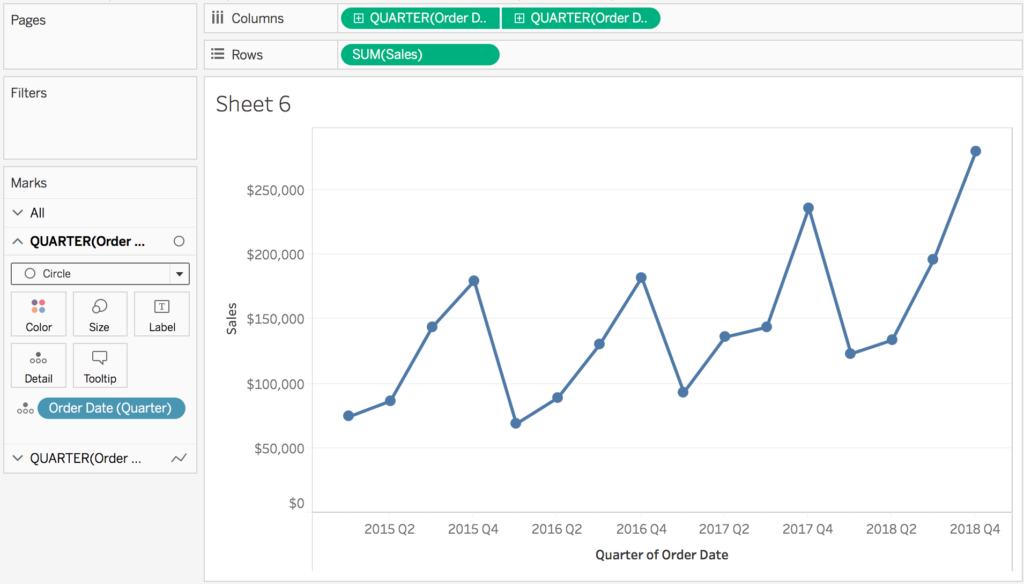
- Create a new date calculation called “Order Date (Quarter)”. Or, swap out ‘quarter’ for your preferred date granularity. In order to get the set action to work, the date has to be converted to a string.
STR(DATETRUNC('quarter', [Order Date])) - Select the first green QUARTER(Order Date) pill on the rows shelf to bring up the corresponding marks shelf. Change the mark type from automatic/line to circle. Add the “Order Date (Quarter)” calculation, created in the previous step, to the detail mark.
- Create a dynamic small multiples chart using “Sub-Category”. This can be done adopting Ryan Sleeper’s blog post.Add “Sub-Category” to the detail mark on the “All” marks card. Click on “sub-category” pill on the detail mark and change the sort to descending by sales.Create a new calculation called “X Axis”. Add to the columns shelf. Change from continuous to discrete. Change compute using to sub-category. Click on the pill on the columns shelf and uncheck “show header”
(index()-1)%(int(SQRT(size())))
Create a new calculation called “Y Axis”. Add to the rows shelf. Change from continuous to discrete. Change compute using to sub-category. Click on the pill on the rows shelf and uncheck “show header”
int((Index()-1)/ (int(sqrt(size()))))
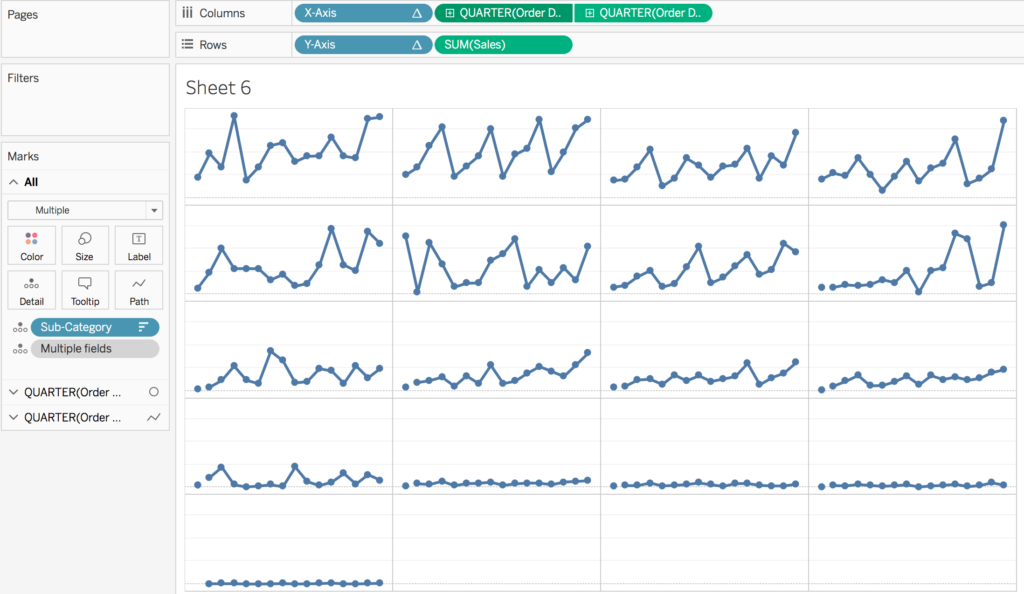
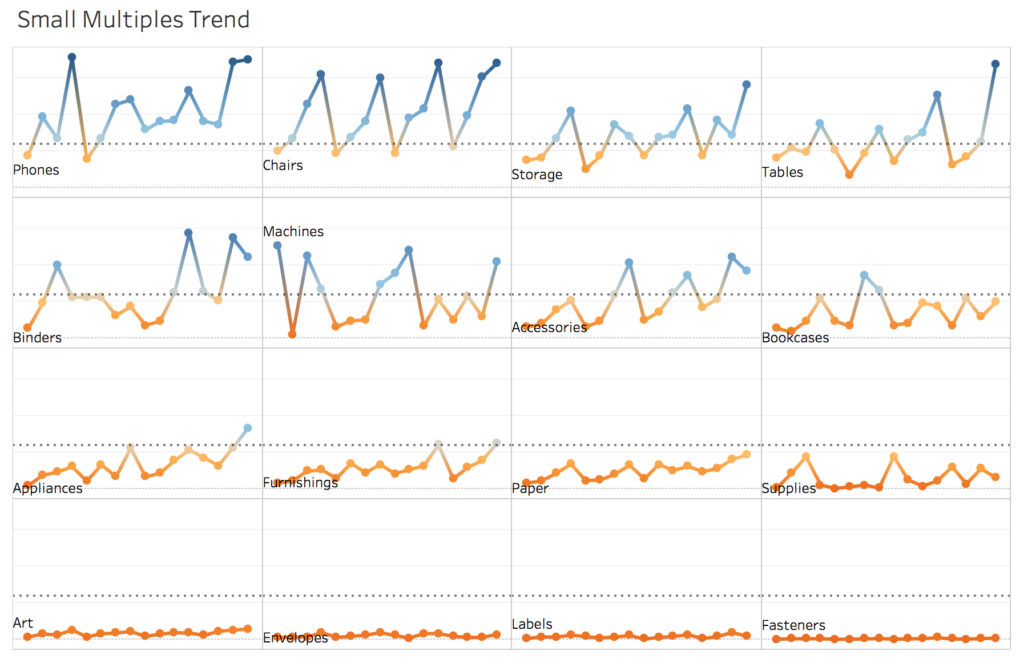
- Click on the order date axis on the top and select move marks to back (to ensure the dot is in front of the line… to double check if this worked, change the color of either the line or circle). Click on the “Sales” and “QUARTER(Order Date)” pills and uncheck “show header” (removing for cleanliness sake, but feel free to keep!). Click on the second “QUARTER(Order Date)” pill to bring up the corresponding marks shelf. Edit the size of the circle, making it smaller. Your worksheet should now look like this:
- Create a new set using sub-category. This can be done by right clicking on “Sub-Category” in the dimensions pane and selecting create > set. Name the set “Sub-Category Set”. Leave it on select from list, with no values selected.
- Create a new set using Order Date (Quarter), the calculation created in step 3. Name the set “Order Date Set”. Leave it on select from list, with no values selected.
- Create a new calculated field called “Selected Sales”. This calculation is saying only return the sales values from those sub-categories that are in the set. We also want to include the order date set to allow us to return the point on the trend we are hovering over. Wrapping it in the LOD allows us to compare other sub-categories sales to the selected sub-category’s sales.
SUM({SUM(ZN(if [Sub-Category Set] AND [Order Date Set] then [Sales] END))}) - Create a new calculated field called “Comparison to Selected”
SUM([Sales])-[Selected Sales]
- Add the “Comparison to Selected” field to the color mark on the “all” marks shelf
- Add the “Selected Sales” field to the detail mark on the “all” marks shelf
- Go to the analytics pane. Add an average line, at the pane level. Edit the reference line and change the value to “Selected Sales”. Change the label to none and the line format to dotted.
- Exclude the sub-category of “copiers” from the view to make it a nice 16 x 16 grid (also: there is missing data from copiers that forces the dynamic grid to get messed up. There are ways to account for that, but for this demo, I am just going to exclude it).
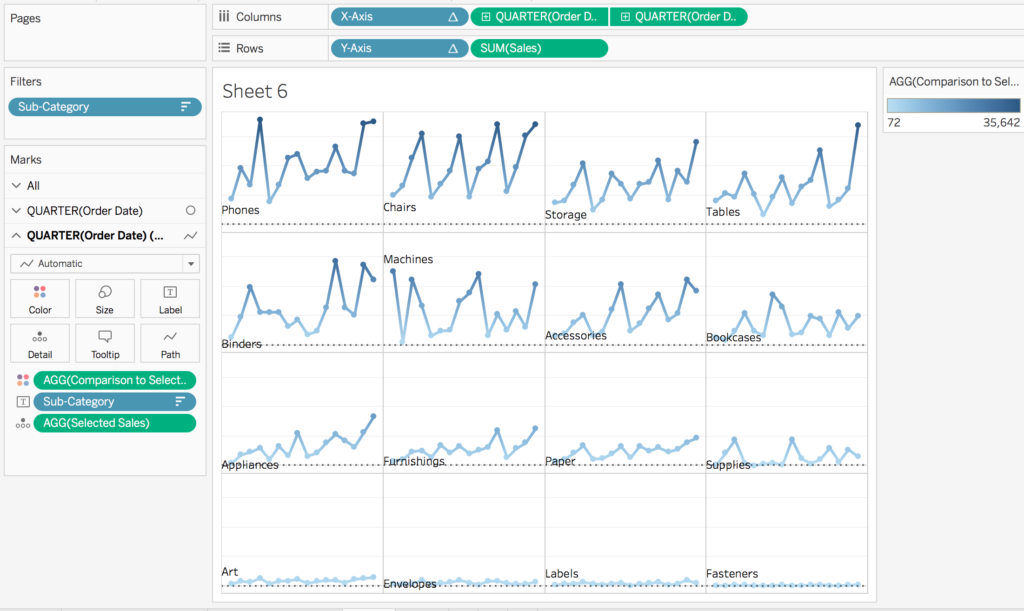
- Click on the second QUARTER(Order Date) field on the columns shelf to bring up the corresponding marks card. Add “Sub-Category” to label and change it to show lines ends. Uncheck label end of line.
Your worksheet should now look like this:
- Create a new dashboard and add the trend line small multiple worksheet to it.
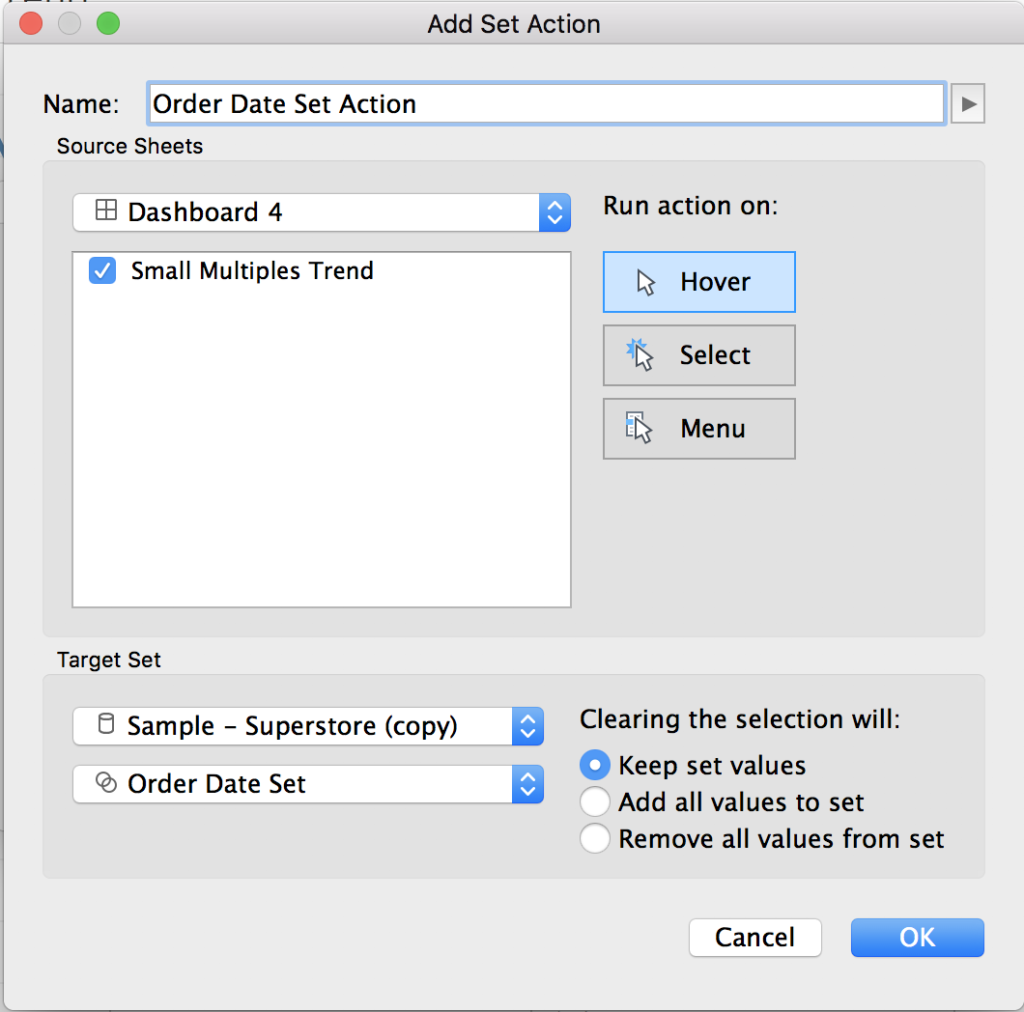
- Add a new set action. This can be done by going to dashboard > actions > add actions > change set values. Call the set action “Order Date Set Action”. Change the run action to “hover” or “select”. Note: hover works great on desktop… but is glitchy on Tableau Public. Select the target set of sample superstore and target the order date set. Change the clearing the selection to keep set values.
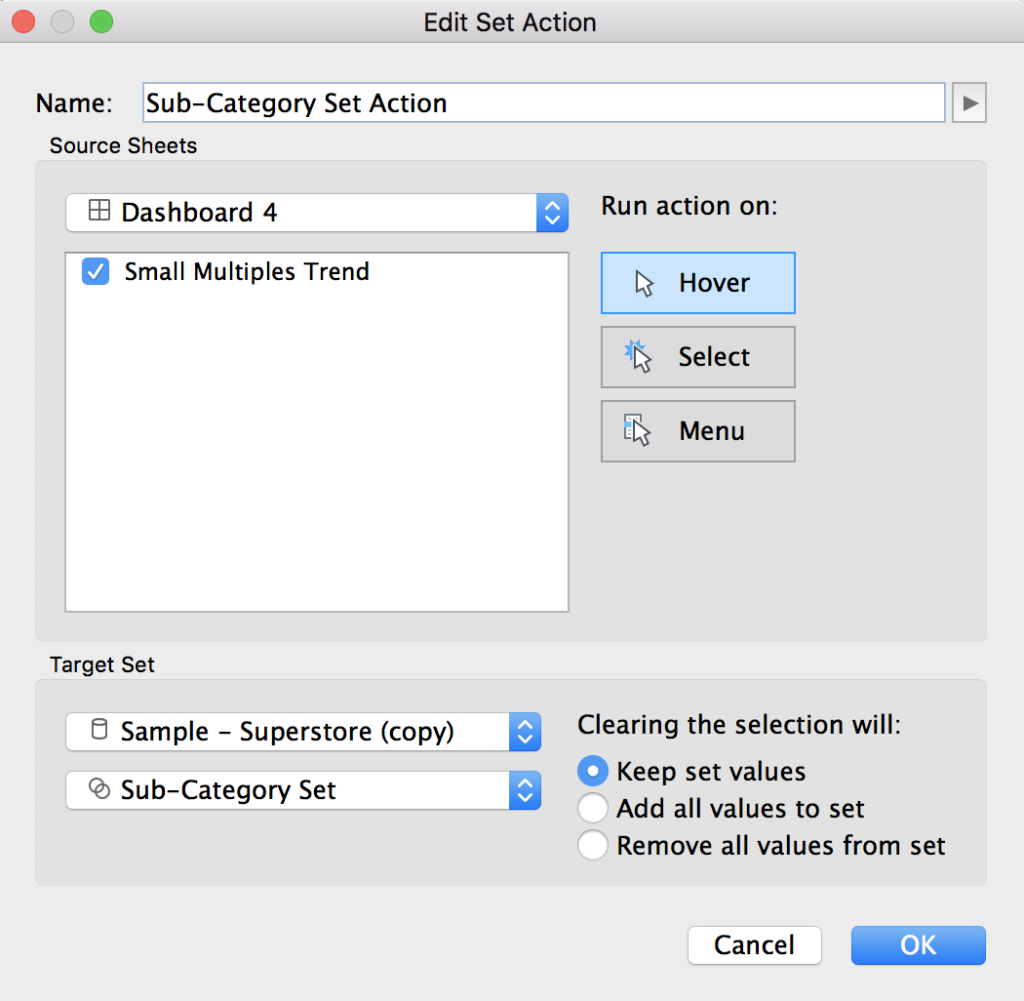
- Repeat the same steps above to create another set action, “Sub-Category Set Action”. Change the run action to “hover” or “select”. Note: hover works great on desktop… but is glitchy on Tableau Public. It should look like this:
- Test it out! Hover (or select) over any data point and watch the reference line and colors update. Note: you have to hover/select a circle and not the line to update the set.
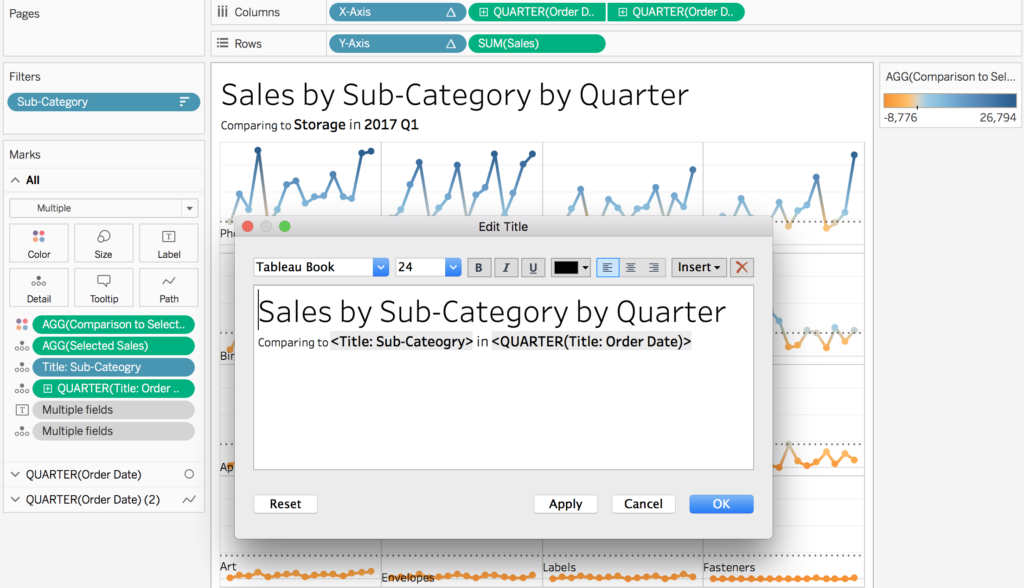
- Create two last calculations to add to the title to allow the user to see what they are currently highlighting. After creating these calculations add them to the “all” marks card on detail.Title: Sub-Category
{MIN(if [Sub-Category Set] then [Sub-Category] end)}Title: Order Date (upon adding to detail mark, make sure to change from year to quarter)
{MIN(if [Order Date Set] then DATETRUNC('quarter', [Order Date]) end)} - Update the title to include the new calculations
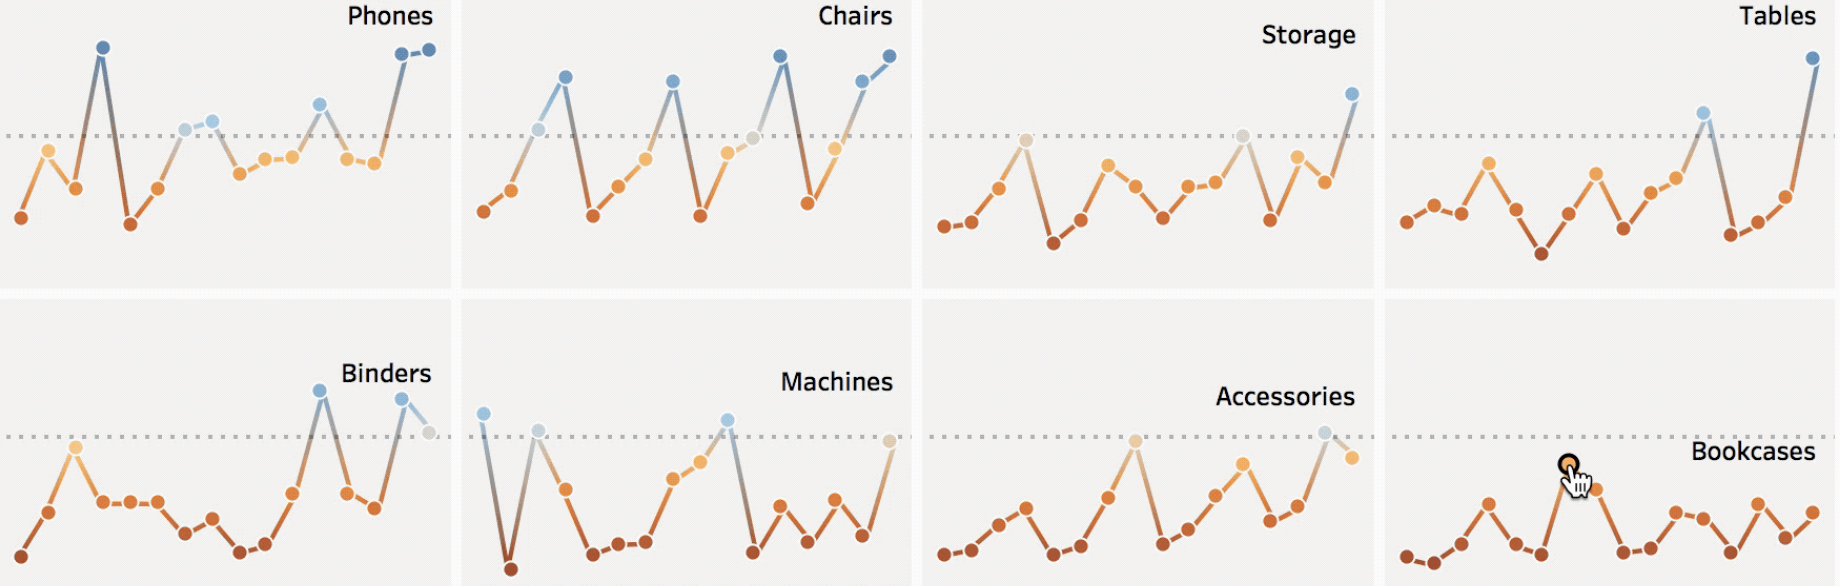
- Make any additional formatting changes and you are done!
To view my working example on Tableau Public or to download my workbook, click here. Also, check out the other dashboards in the workbook detailing different ways use set actions.