The What
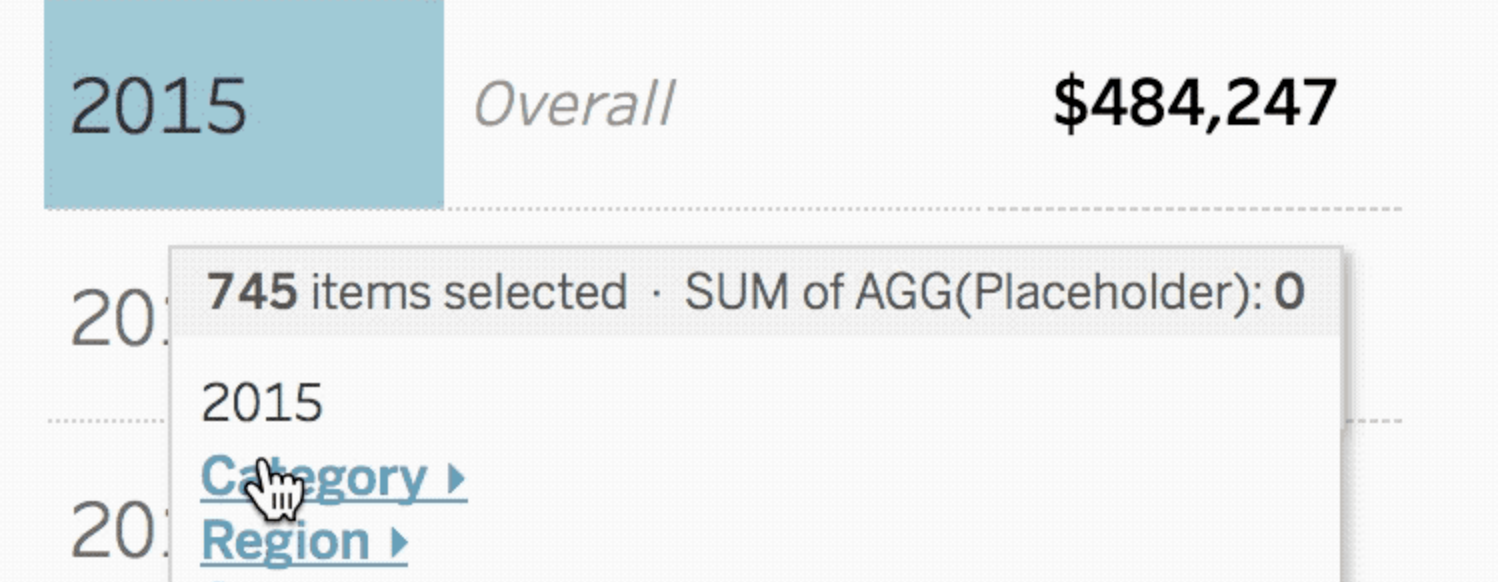
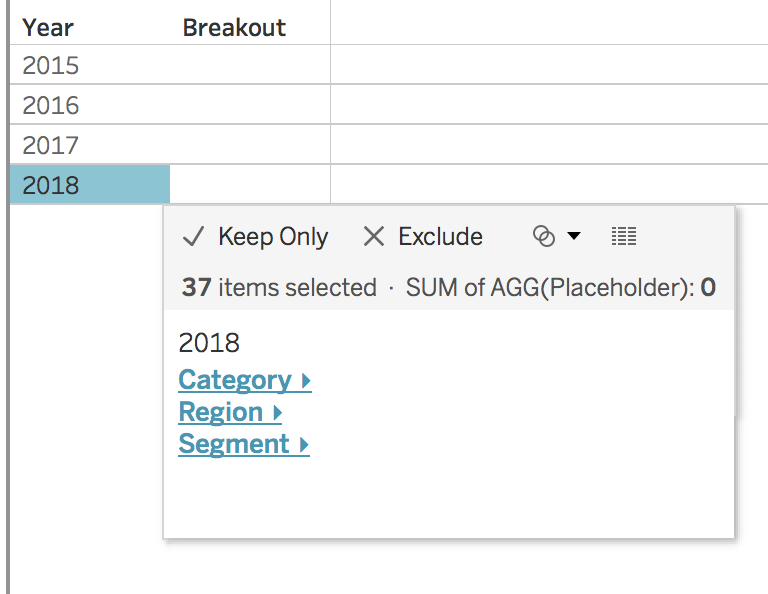
Allow the end user to choose what they want to break down a dimension by. By clicking on a year, such as 2015, the user can decide if they want to see 2015 broken out by category, region, segment, or top 5 cities.
The How
- Determine the main dimension to display as well as the secondary dimensions that the user should be able to breakout the main dimension by. I am going to choose year as the main dimension and the following as secondary: region, segment, and category.
- Create a new calculation called “Placeholder”
MIN(0)
- Create a new calculation called “Year”. After creating, right click on the calculation in the measures shelf and select “convert to dimension” (a calculation only needs to be created if using year… if using any other dimension, just add that to the rows shelf)
DATEPART('year', [Order Date]) - Add “Year” to rows and “Placeholder” to columns
- Add every secondary metric determined in step 1 (region, segment, category) to the detail mark
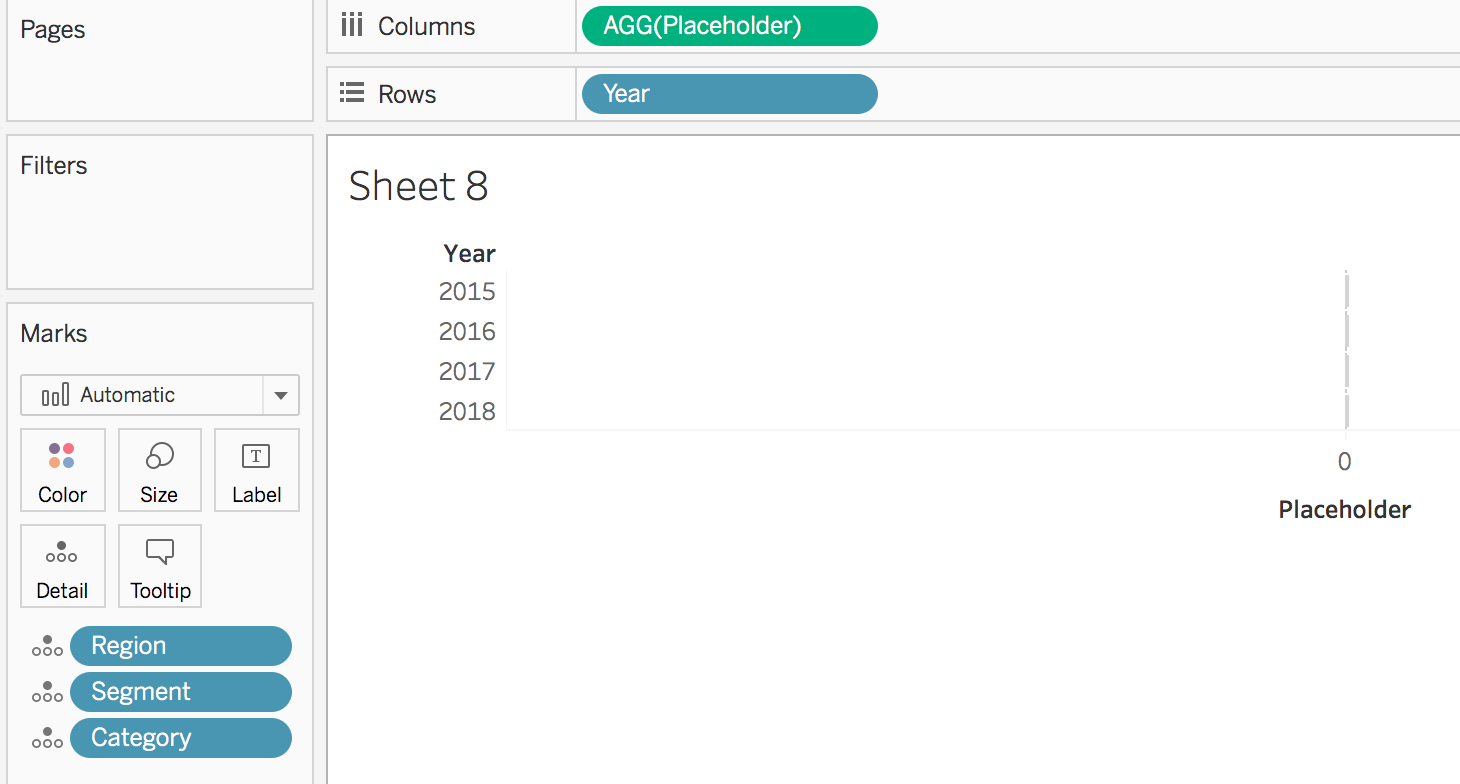
- Add another instance of “Placeholder” to the columns shelf.
- Click on the first “Placeholder” pill on the columns shelf to bring up the corresponding marks card. Change the mark type to “text”. Add “Placeholder” to the label mark. Then click on the text mark > ‘…’ next to text. Clear out all text in the text box.

- Click on the second “Placeholder” pill on the columns shelf to bring up the corresponding marks card. Change the mark type to “text”. Remove the secondary dimensions (region, segment, and category) from the shelf. Add “Sales” to the text mark.
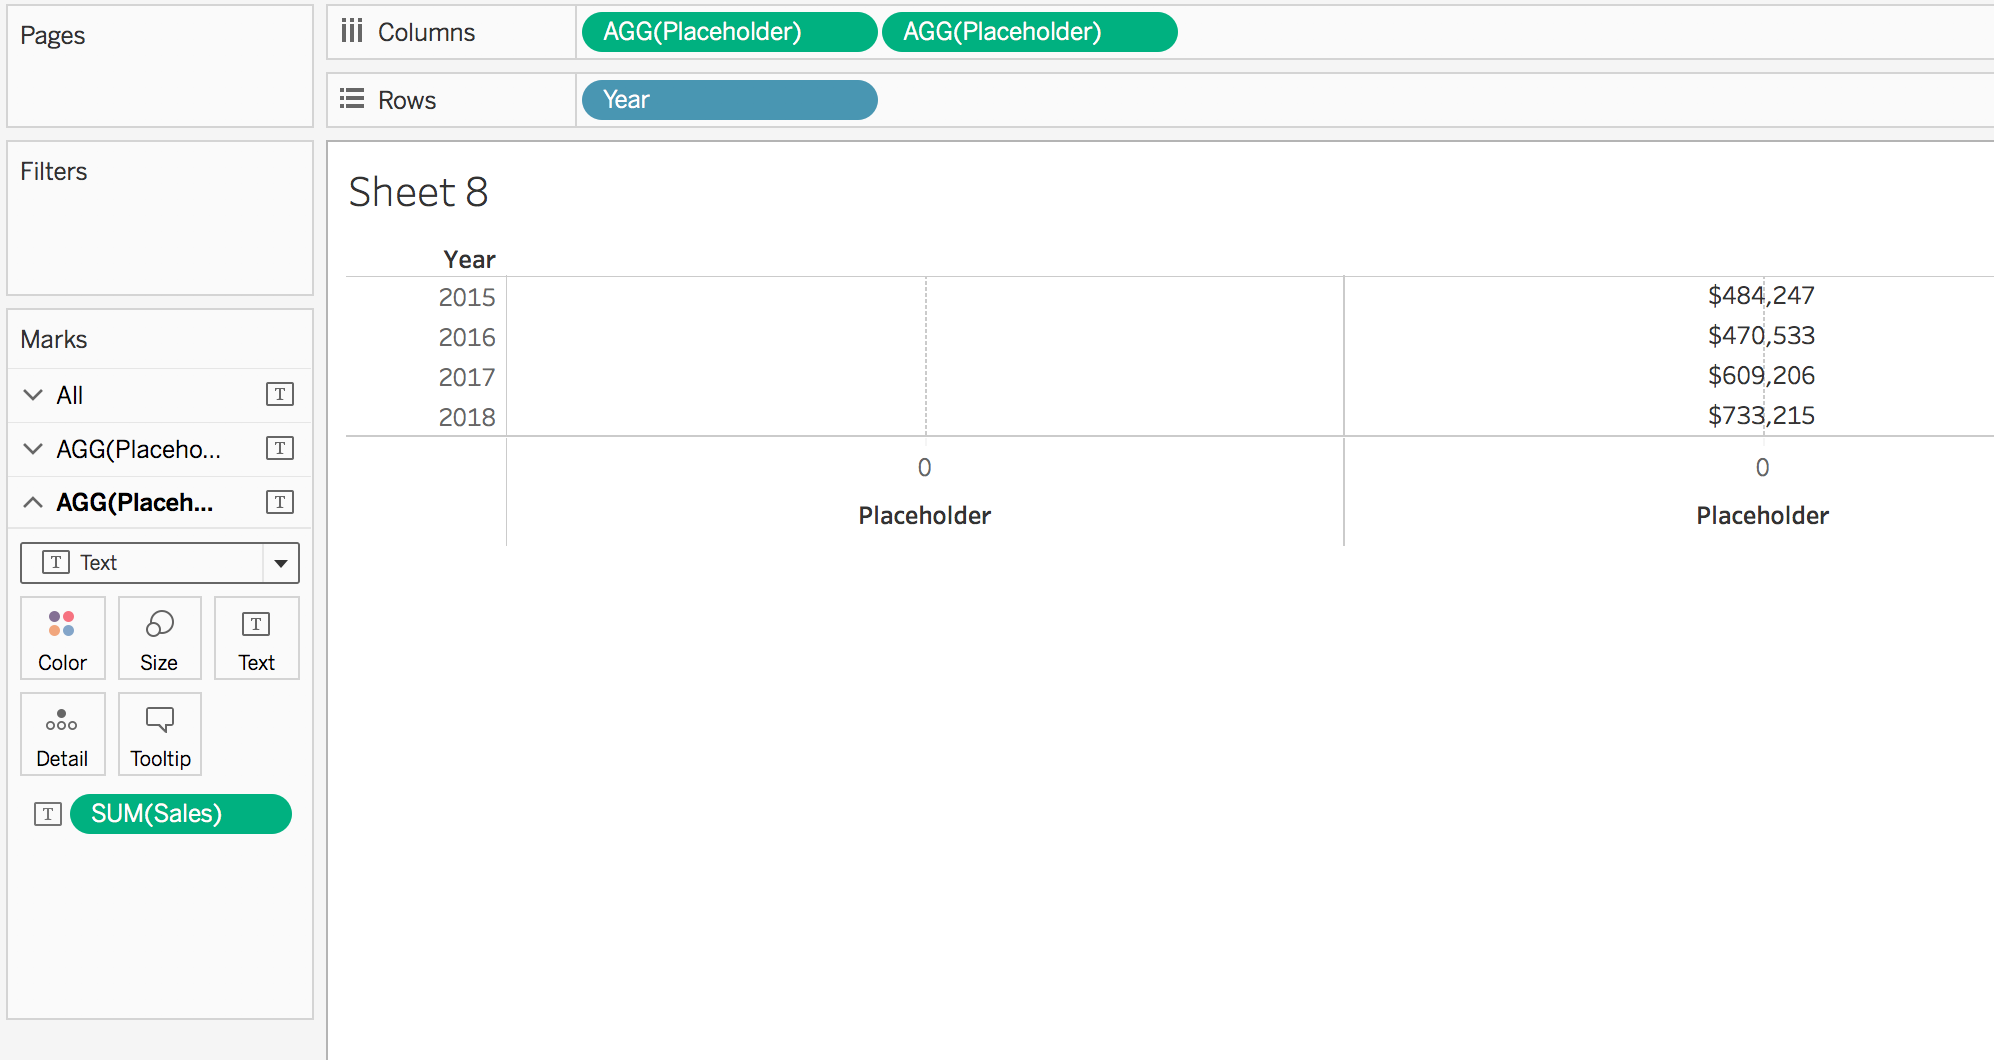
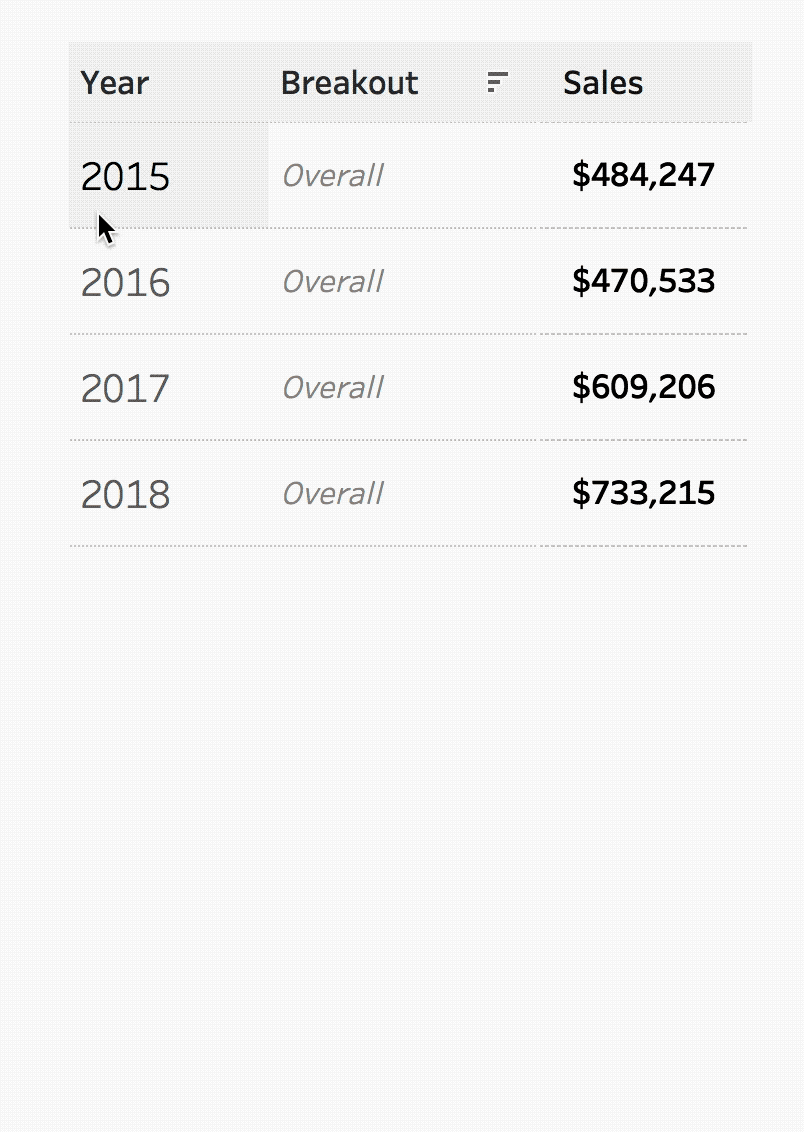
- Select the second “Placeholder” pill on the columns shelf and select dual axis. We now see the SUM(Sales) for each year. However, having the secondary dimensions “hidden” on the first placeholder, allows the necessary detail to be present to make the set actions work
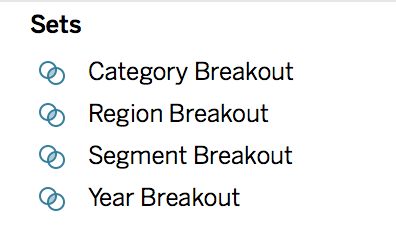
- Create four new sets (one for the main dimension and three for each of the secondary dimensions). To do this, right click on the dimension in the dimension shelf and select create > set. Name the set something relevant, such as “Category Breakout”. Don’t change any of the settings and click okay.
- Create a new calculation called “Breakout”. It will use the following format:
IF [Main Dimension Set] and [Secondary Dimension #1 Set] then [Secondary Dimension #1]
ELSEIF [Main Dimension Set] and [Secondary Dimension #2 Set] then [Secondary Dimension #2]
ELSEIF [Main Dimension Set] and [Secondary Dimension #3 Set] then [Secondary Dimension #3]
else ""
END
For this example, the calculation looks like:
IF [Year Breakout] and [Category Breakout] then [Category]
ELSEIF [Year Breakout] and [Region Breakout] then [Region]
ELSEIF [Year Breakout] and [Segment Breakout] then [Segment]
else ""
END
- Add the “Breakout” calculation to the rows shelf
- Add the worksheet to a new dashboard
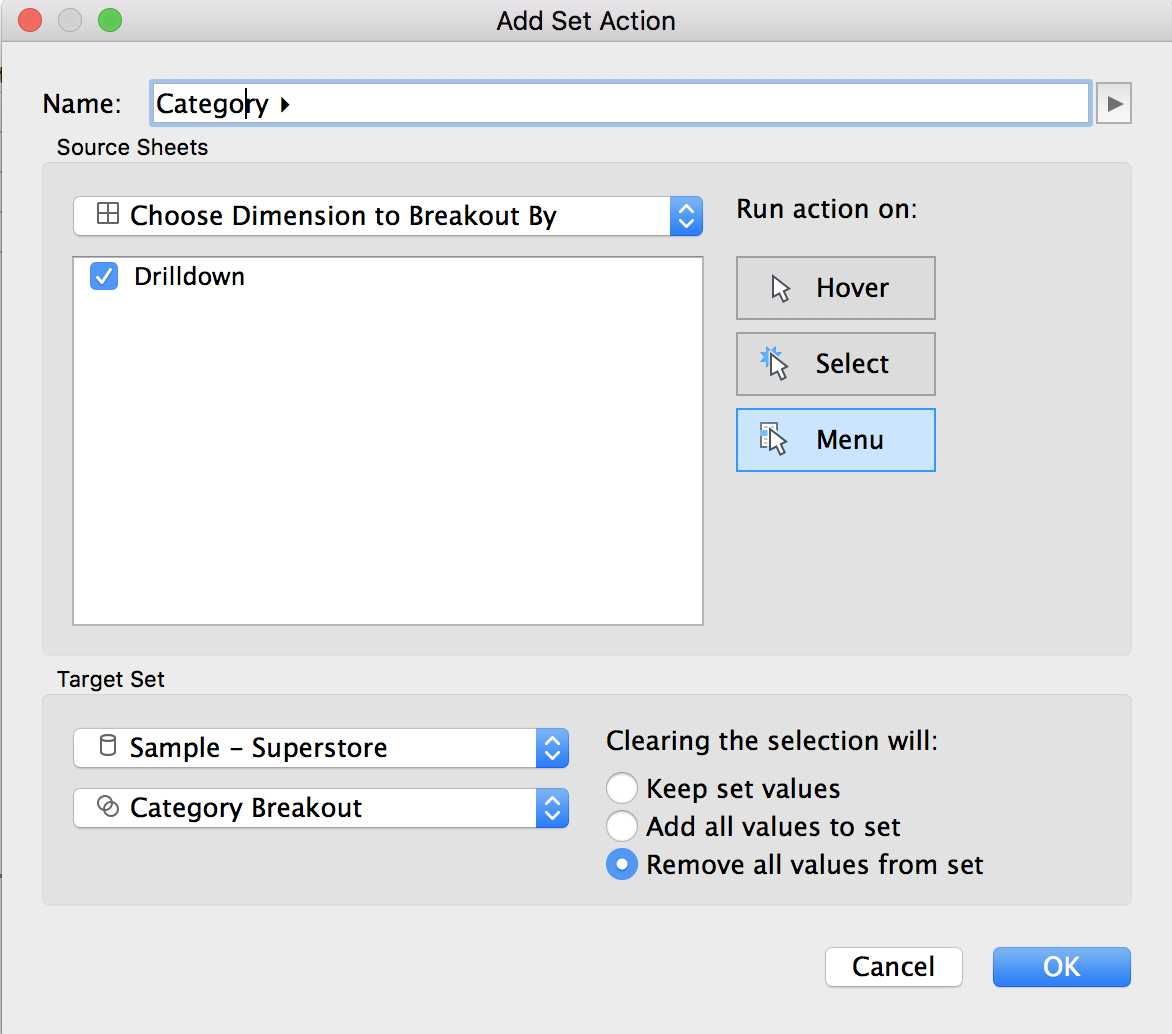
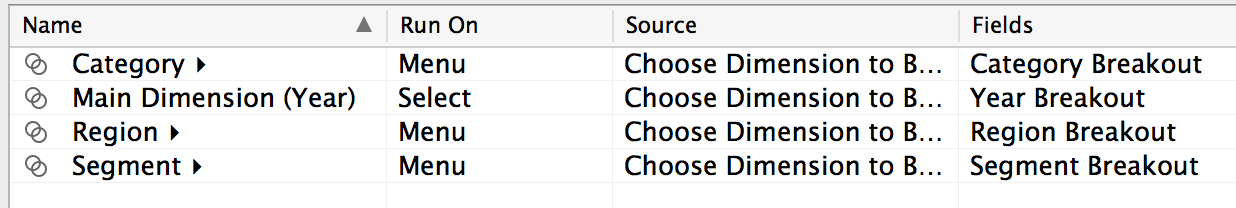
- Create a new dashboard set action for the main dimension. This can be done by selecting dashboard > actions > add action > change set values. For the source sheet, select the dashboard and the worksheet just created. Run the action on select. For the target set, choose the data set as well as the main dimension set (year in this example). Clearing the selection will remove all values from set.

- Create three new set actions, one for each of the secondary dimensions, using the following settings. The name of the set action is what the user will see and select, so name it something the user understands. In this case, I added an alt code triangle, ▸. For the source sheet, select the dashboard and the worksheet just created. We want the action to run on “menu” so the user can choose which dimension they want. For the target set, choose the data set as well as the secondary dimension set. Clearing the selection will remove all values from set.
 There should now be four sets:
- Test it out! Clicking on the main dimension (year) should bring up the ability to choose category, region, or segment.
- The last step is to format it. Some tips:
-Remove the placeholder header
-Remove zero lines, column dividers, and column grid lines
-Remove tooltips (or at the very least, uncheck include command buttons)
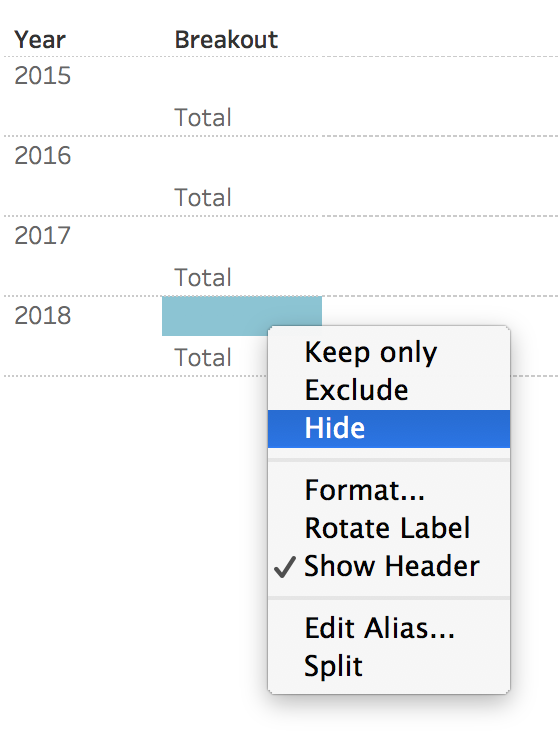
-Add subtotals. Then, click on the empty cell and right click “hide”. Move column totals to top. Change the word total to overall.
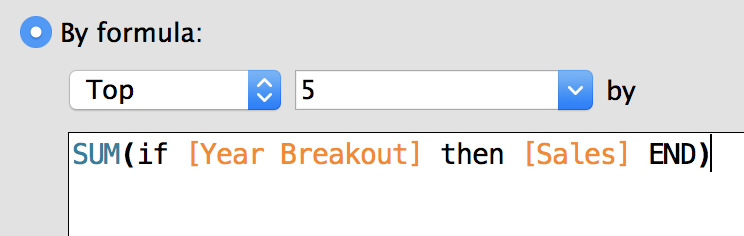
-Add a “Top N” Set, such as “Top 5 Cities”. To do this, create a set on the desired dimension. In the “top” tab write a formula that says SUM(IF [Main Dimension Set] then [Metric] END)
To view my working example on Tableau Public or to download my workbook, click here. Also, check out the other dashboards in the workbook detailing different ways use set actions.