I previously wrote about how to change dimensions using set actions. However, I have since found a better, easier way that can work for metrics OR dimensions. Previously, you had to unselect a value before selecting the next. This method does not require that!
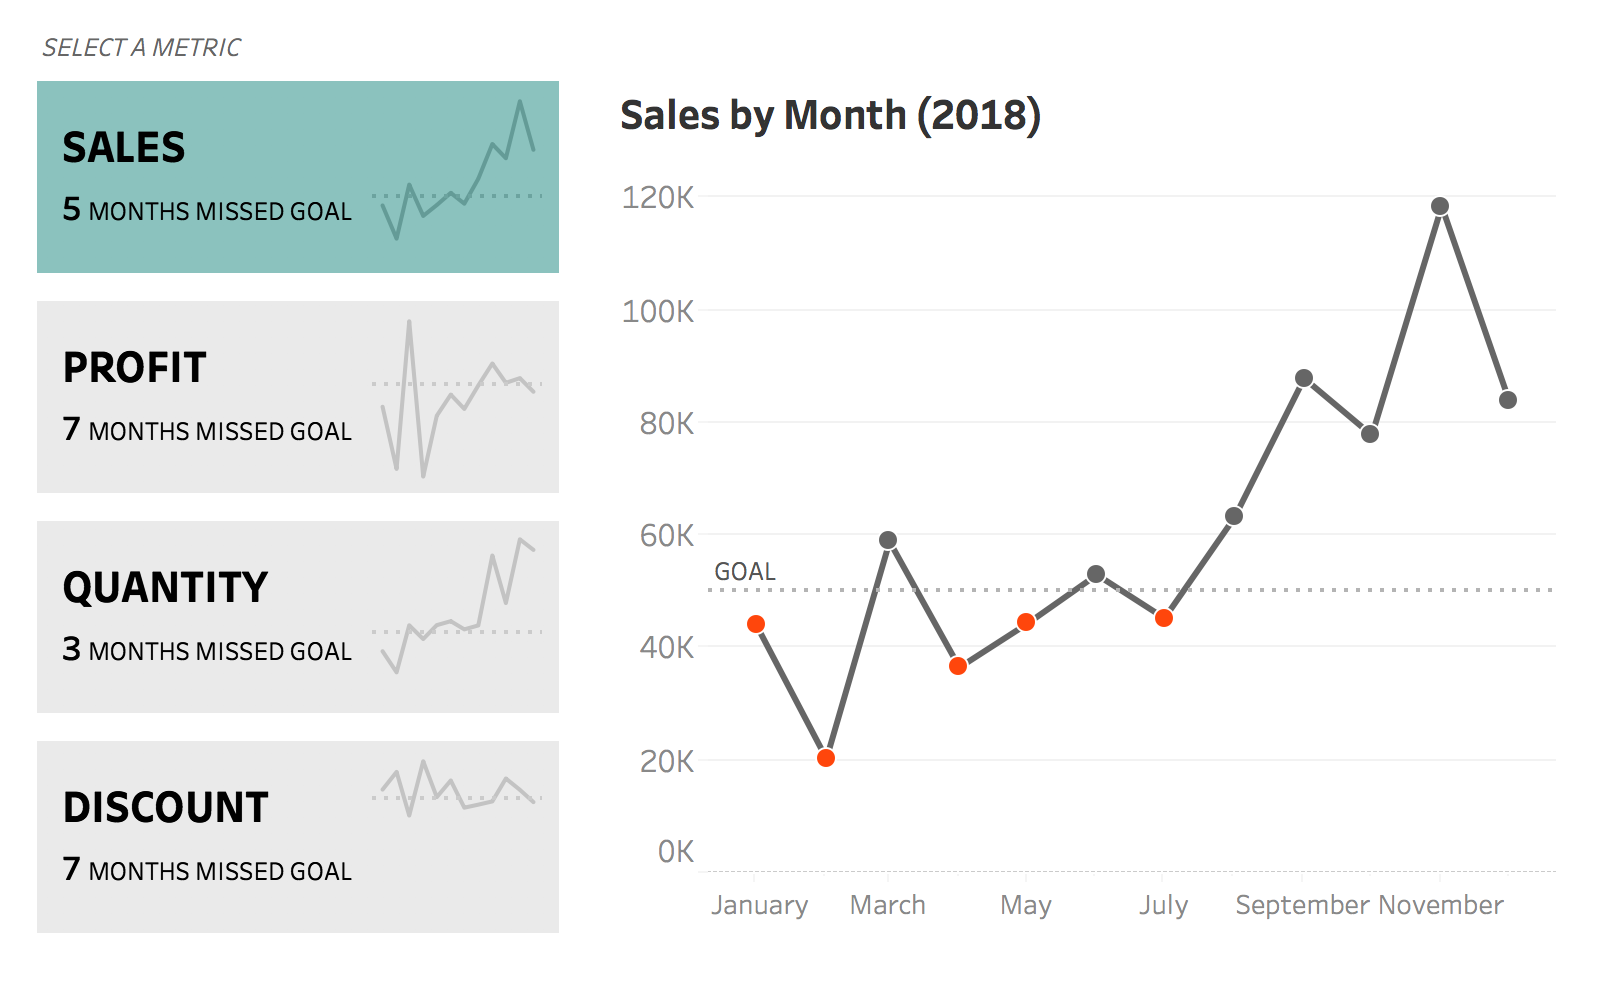
This can be extended even further to add text for additional insight or information. I then used transparent worksheets to add a trend line of each metric to create a custom button for each metric:
This methodology can also be used to swap worksheets, as Matt Chambers demonstrates on his blog.
How To
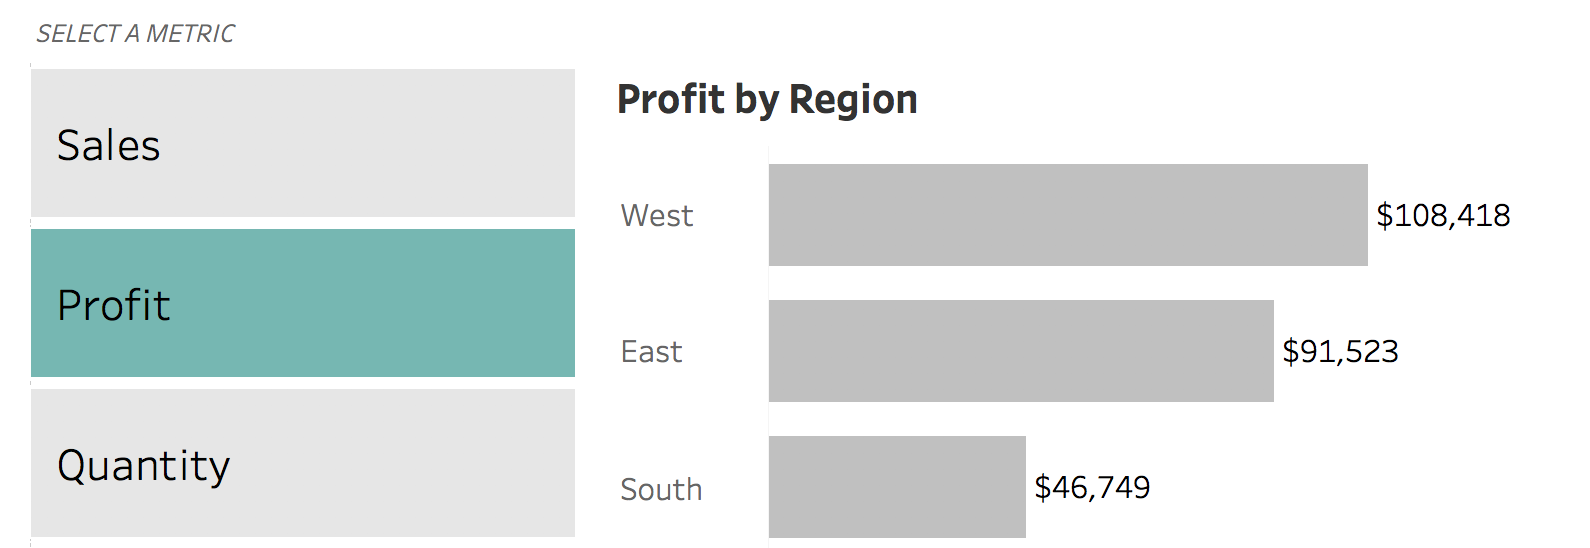
- Determine which metrics (or dimensions) to use. I am going to use profit, quantity, sales, and discount.
- Find any dimension that has equal or more values. For example, region has four values, east/west/south/central. Since I have four metrics I want to use, this will work out! The way this method works is that selecting the east region will correspond to one metric, the west will correspond to another metric, etc.
- Create a new set on the selected dimension, region. This can be done by right clicking on the desired dimension (ex: region) and selecting create > set. Name the set “Metric” and select a value of “East”
- Create a new calculation called Metric Calc. Here we will assign each metric to the specified region. The part after the case statement is how we determine what value is in the set.
case {MIN(if [Metric] then [Region] END)} when "Central" then [Sales] when "East" then [Profit] when "South" then [Quantity] when "West" then [Discount] END - Create a new calculation called Metric Calc Label. This will serve as a way to rename the regions to the proper metric name
case [Region]
when "Central" then "Sales"
when "East" then "Profit"
when "South" then "Quantity"
when "West" then "Discount"
end
- Create a calculation called Metric Show/Hide. Adding this calculation into our view will prevent the user from selecting multiple metrics. Note: right now it only prevents users on desktop from selecting multiple metrics but when published, users could select multiple by holding down command/control (however, it won’t break the view!)
if [Metric] then "show" else "hide" END
- Create one last calculation called placeholder. This will serve as a way to create fake buttons.
MIN(1)
- Add region to the rows shelf. Then to the right of region, add metric show/hide. Add placeholder to the columns shelf.
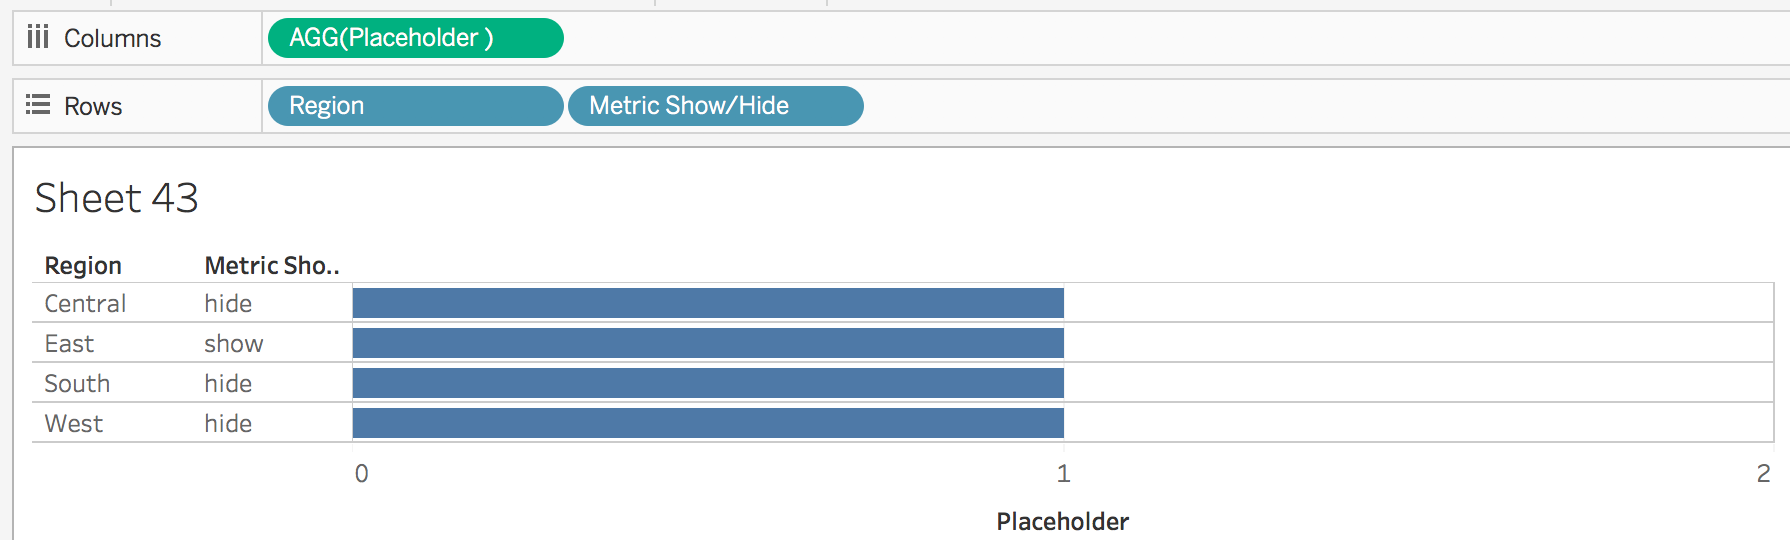
- Add metric label to the label mark. Right click on the placeholder axis and edit to be fixed from 0 to 1. Then right click on the axis and uncheck show header.
- Add the metric set to the color mark.
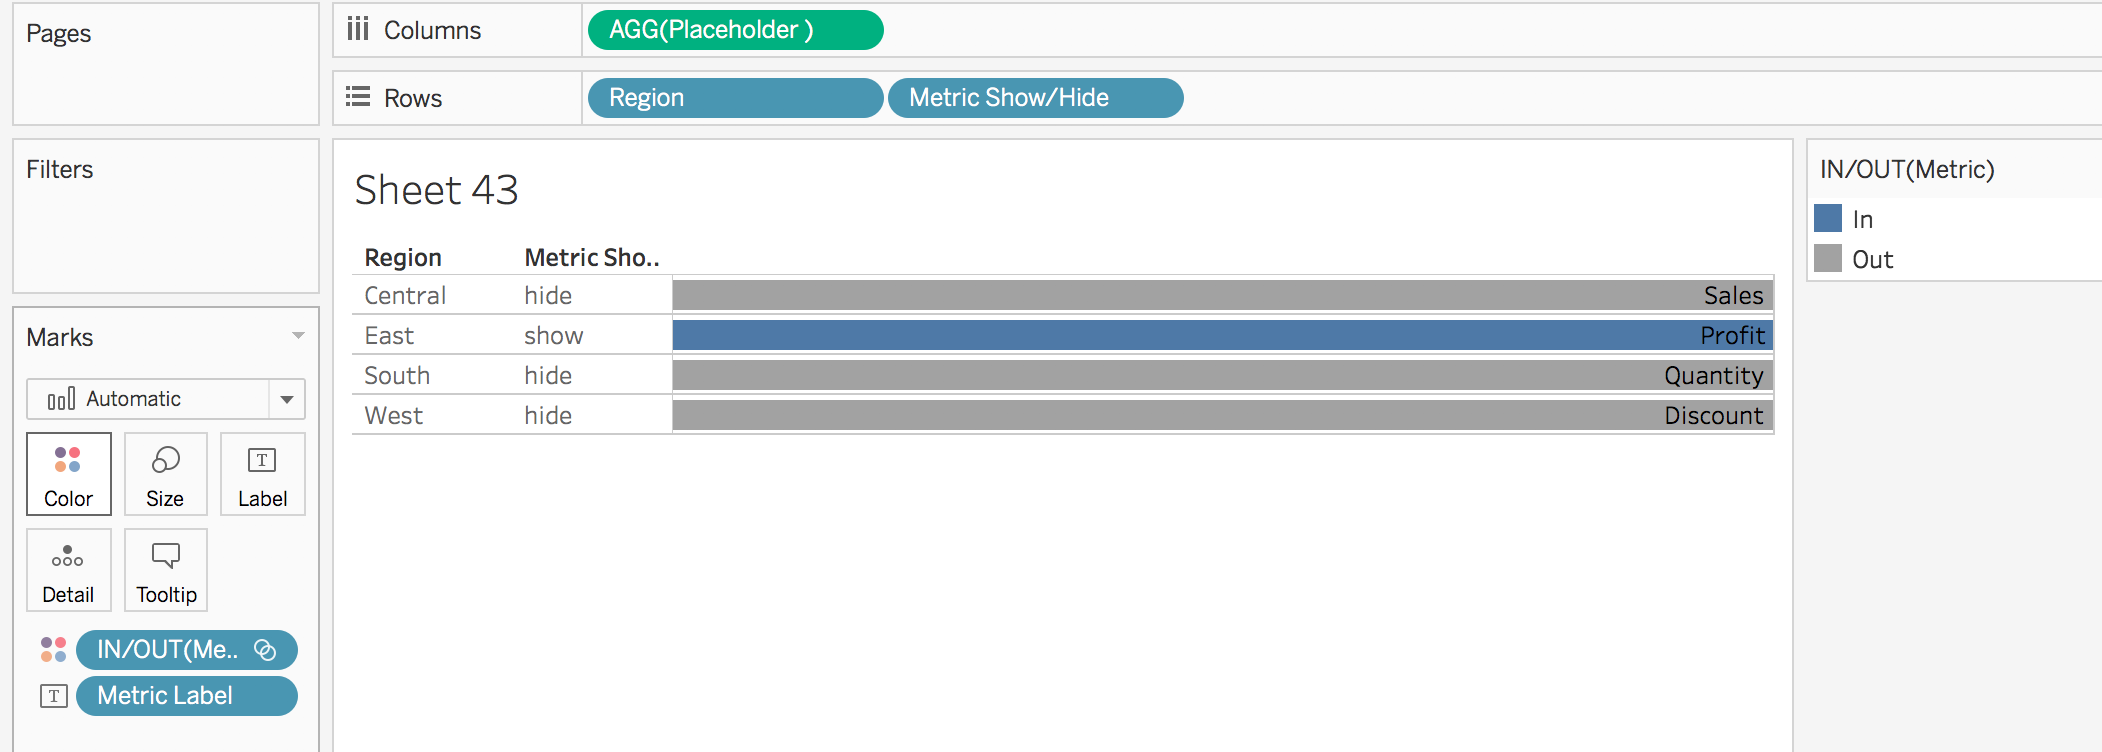
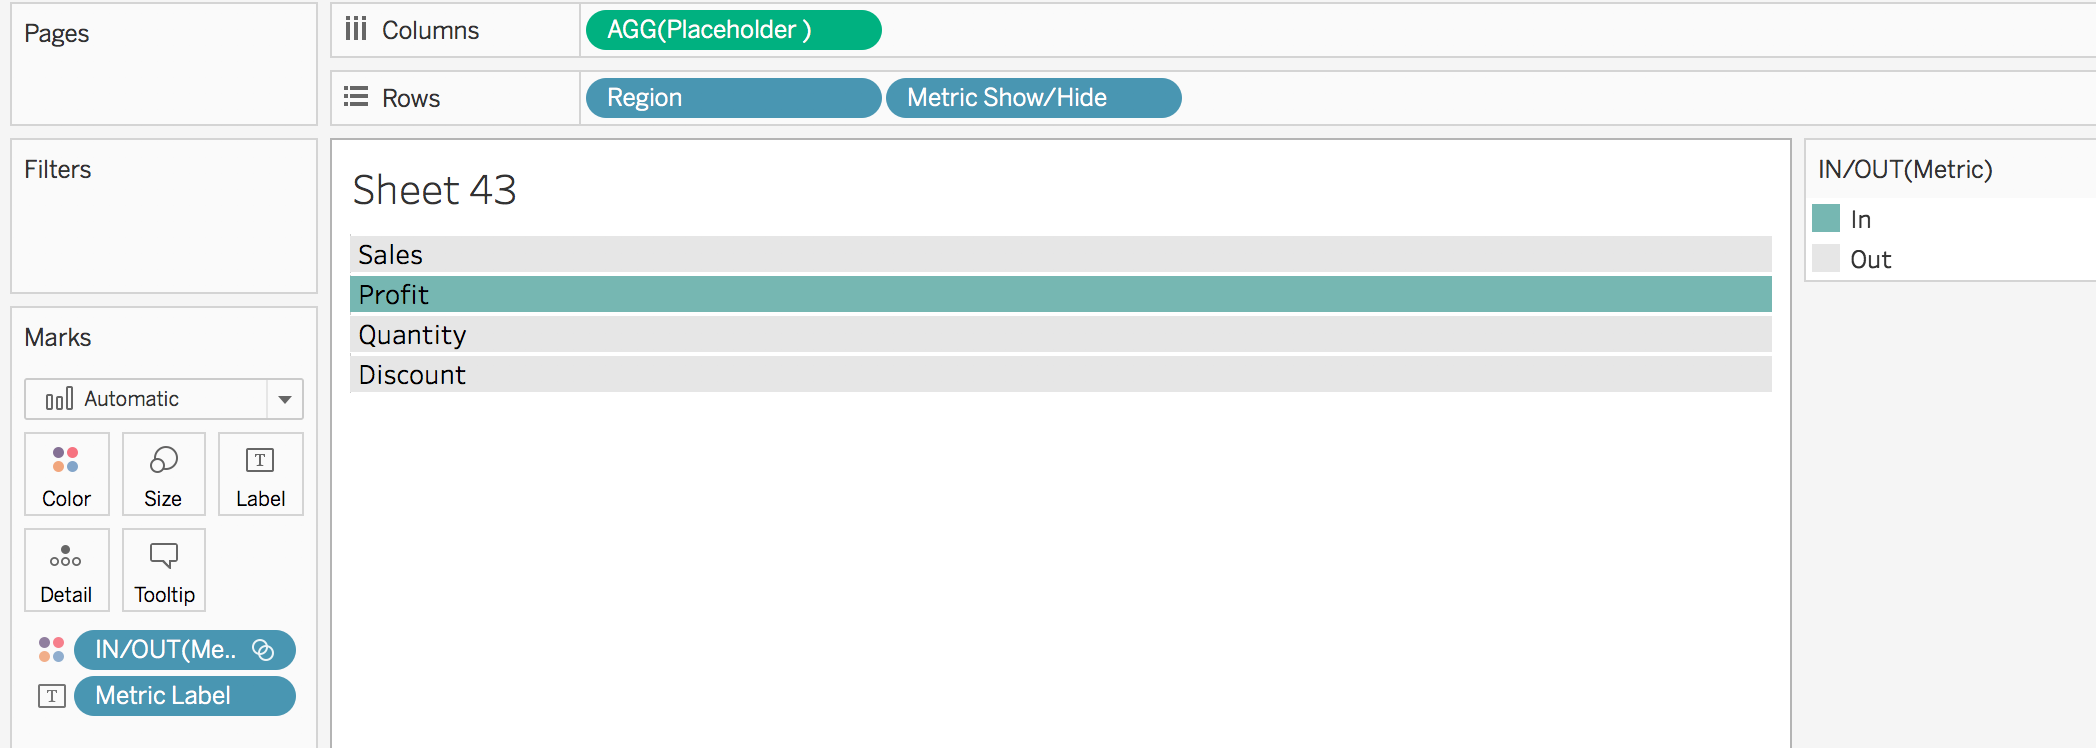
- Clean up the formatting. Click on the region and metric show/hide pill and unselect show header. Set row and column dividers to none. Make the size of the bar slightly bigger. Format the label to be left aligned and change the colors.
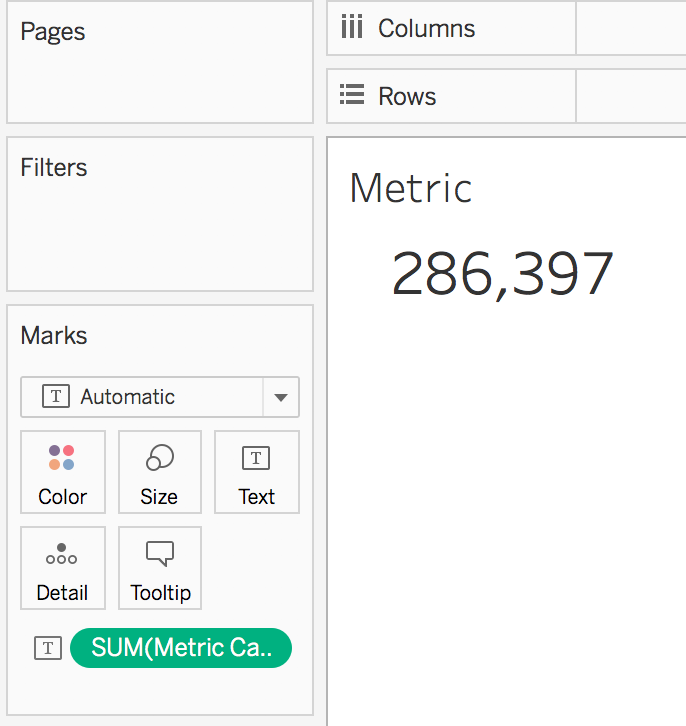
- Create a new worksheet. Add metric calc to the text mark. Update the font size to make larger.
- Create a new dashboard and add both worksheets
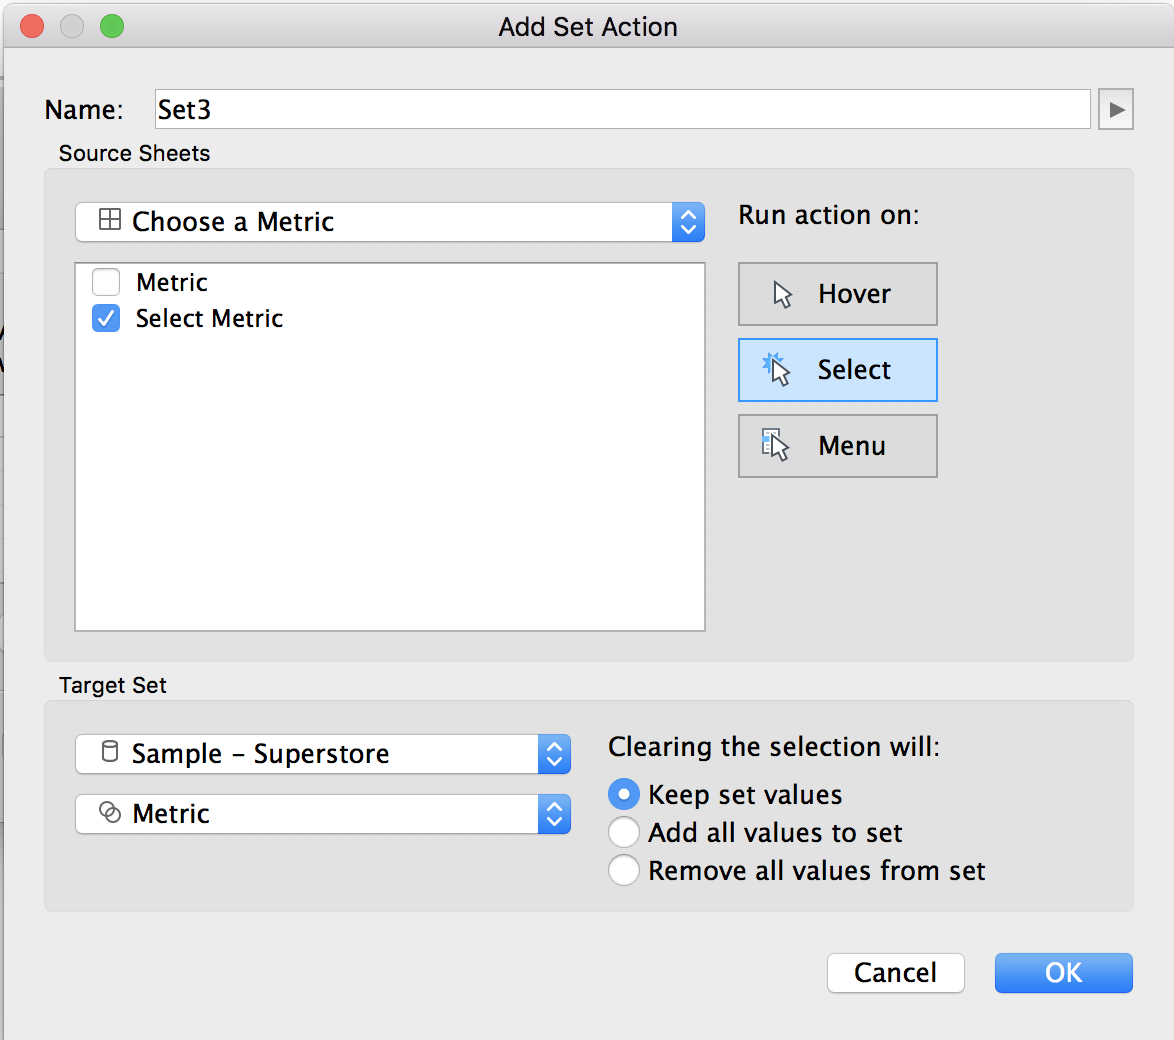
- Add a new set action. This can be done by going to Dashboard > Actions > Add Action > Change Set Values. Run the set on select of the select metric worksheet. Clearing the selecting will keep set values.
- Test it out! Clicking on the desired metric should update the worksheet!
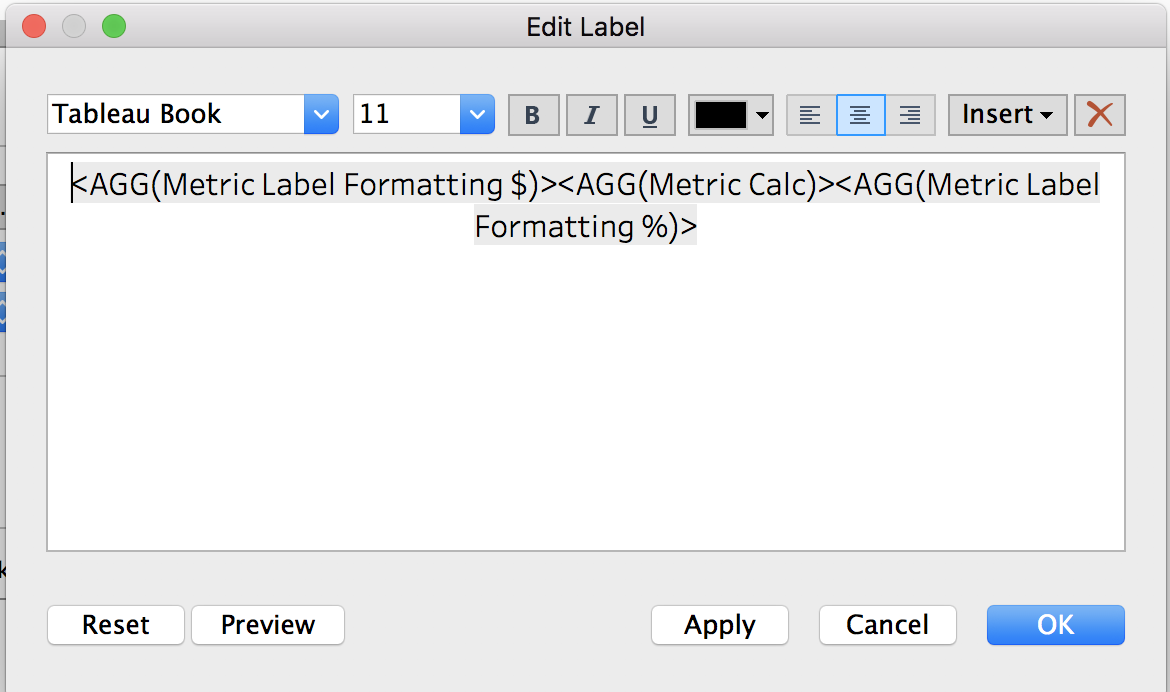
- Because each metric requires different formatting, a calculation (or two) needs to be written to allow sales and profit to show as currency and discount to show as a %. Check out Ryan’s blog post for one method to do this and Decisive Data for another. I used the following for sales and profit:
case MIN({MIN(if [Metric] then [Region] END)})
when "Central" then "$"
when "East" then "$"
END
And the following for discount:
case MIN({MIN(if [Metric] then [Region] END)})
when "West" then "%"
END
I then added them to my label.
To view my working example on Tableau Public or to download my workbook, click here. Also, check out the other dashboards in the workbook detailing different ways to drill down into data using set actions.