Special thanks to Justin Davis, Michael Sandberg, Ryan Hall, Mark Bradbourne, and Matt Chambers.
Set actions, released in Tableau 2018.3, are one of the most powerful new Tableau features since Level of Detail (LOD) expressions. Prior to their release, I had never used sets before. So, it took me a while to wrap my head around the use cases for creating a set and then running an action to dynamically update it. However, in the last 6 weeks of using 2018.3, I have come to realize how revolutionary set actions are. They allow for new ways to interact with data, which in turn improve the end-user experience and facilitate quicker time to insight. I’ve developed a strong understanding of set actions and used them to create everything from a crossword puzzle to a collapsible table with bar charts. In the article below, I’d like to share what I’ve learned about sets and set actions so that you can get started using one of the most exciting new features in Tableau (and if you’ve never used sets before, don’t be afraid!)
What are sets?
Sets allow you to take members within a dimension and group them into two categories: IN or OUT. For example, the region dimension within Sample SuperStore has four values: Central, East, South, and West. If we only wanted to look at data for the Central and West regions, we could create a set with groupings of IN (Central, West) and OUT (South, East).
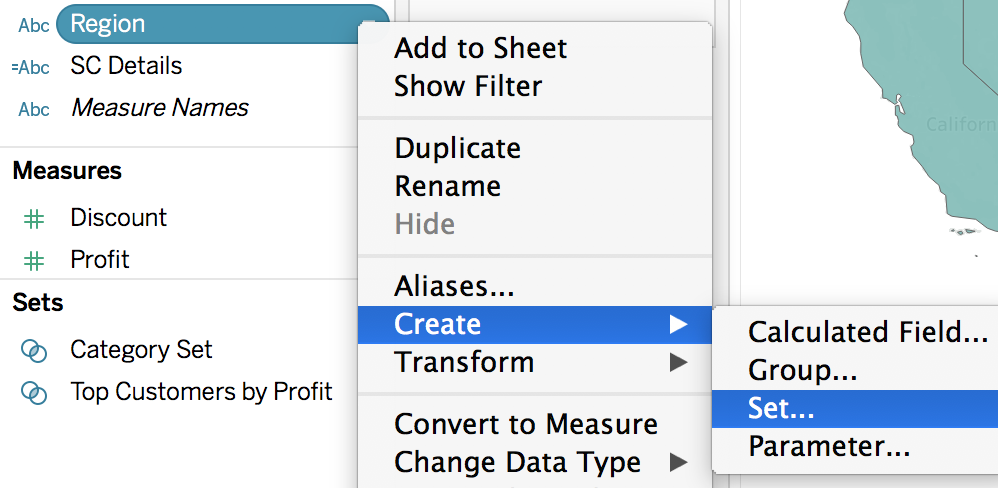
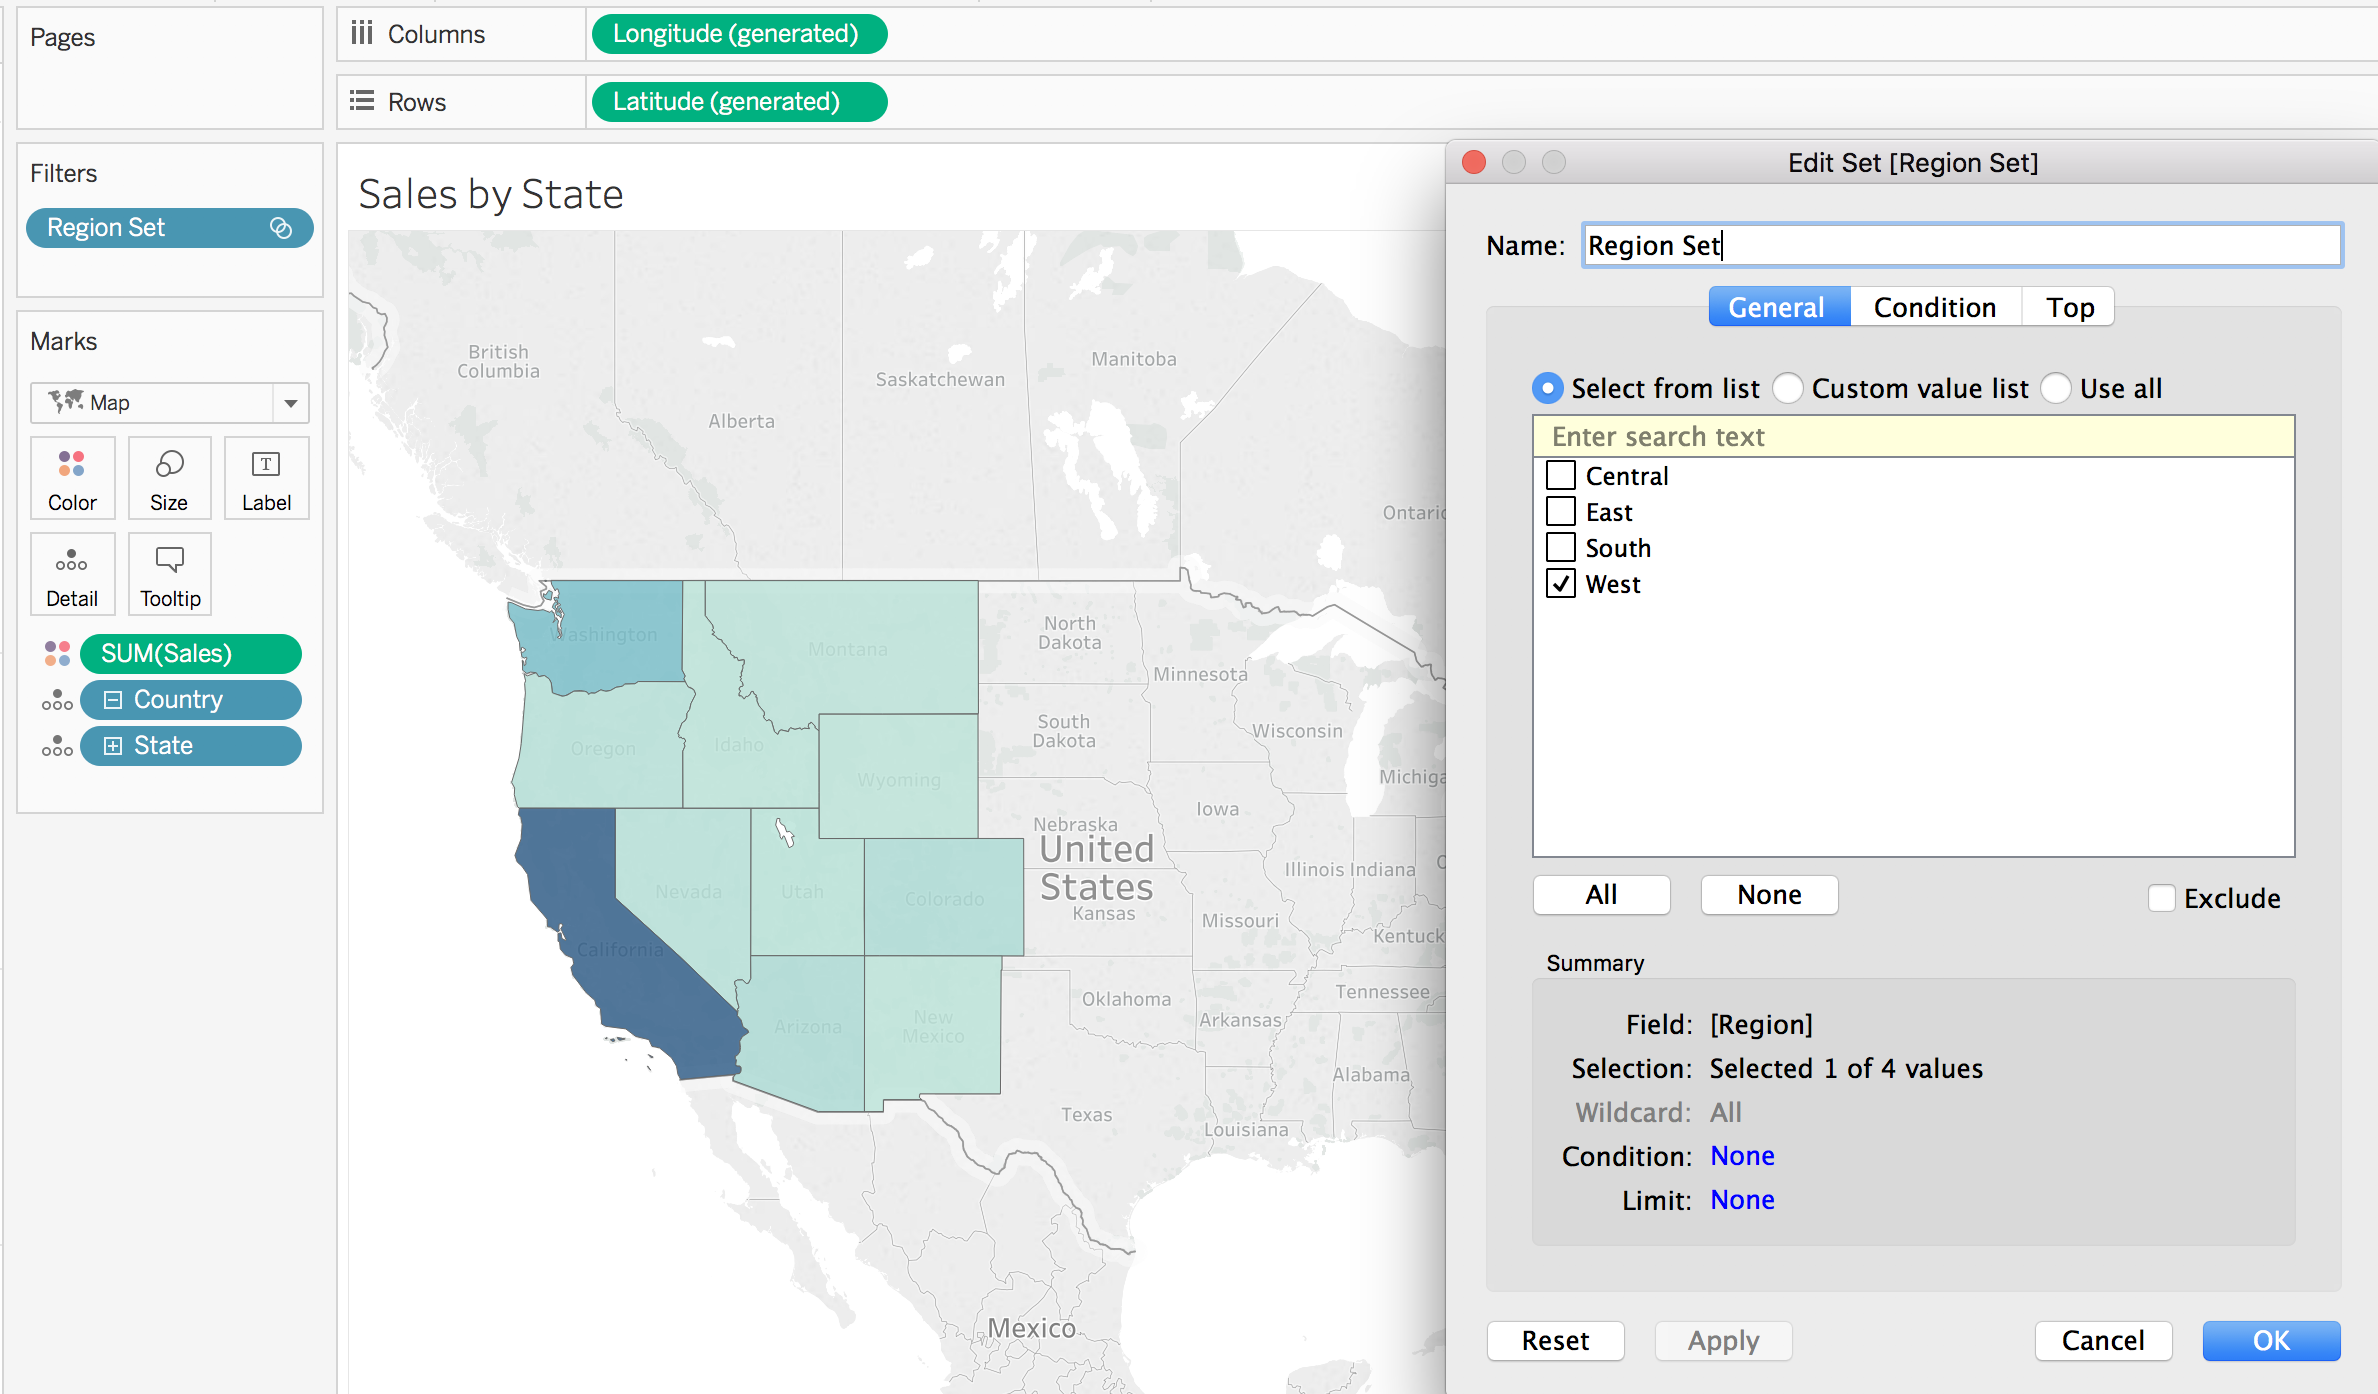
This can be done by right clicking on any dimension in the data pane and selecting create > set.
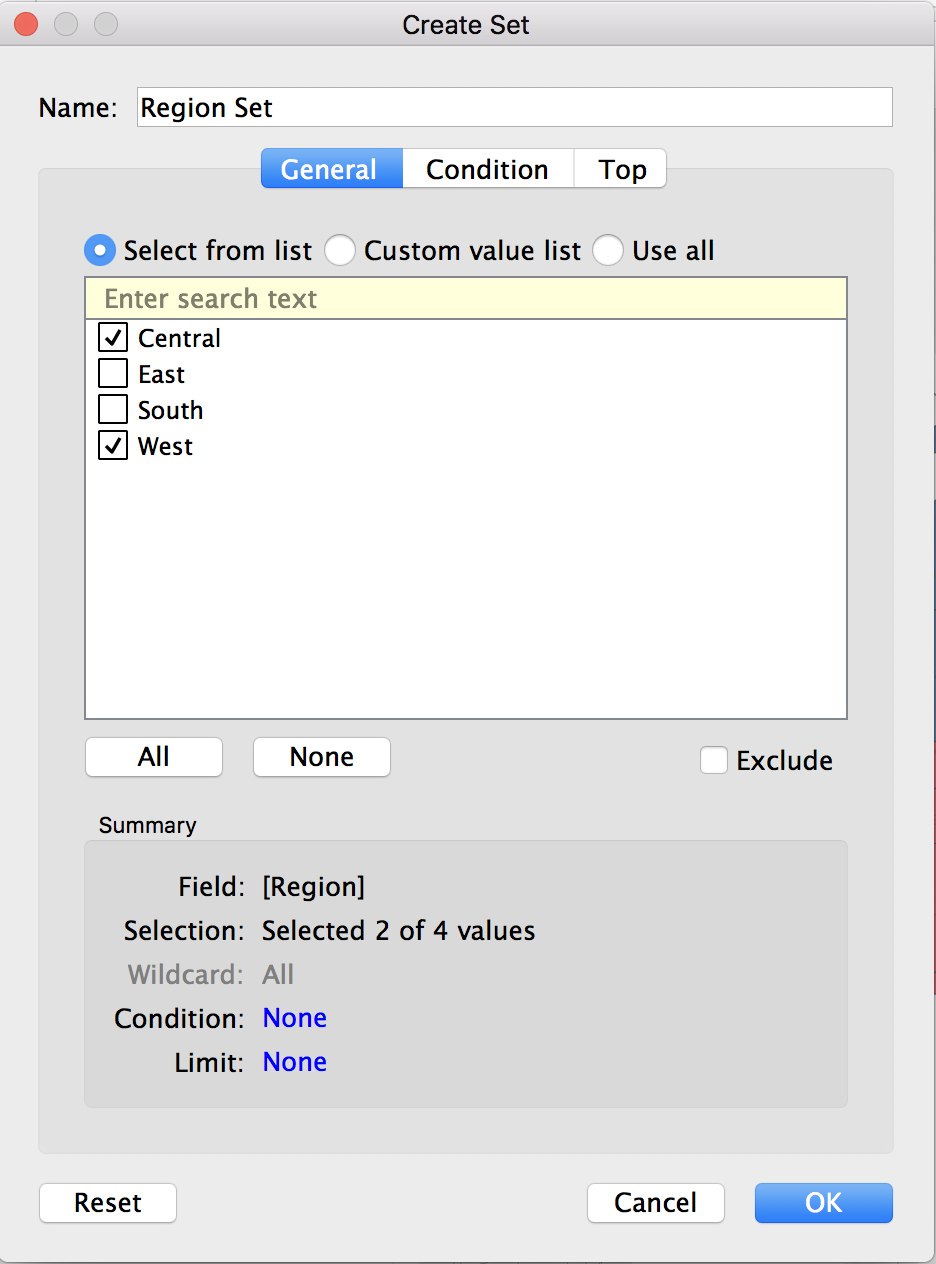
In the set dialogue box, there is the option to choose which values to include IN the set. We can use the condition or top tabs to specify logic that determines the values IN/OUT of the set (e.g., top two regions by sales), or we can manually select which dimension members to include IN the set. For this example, we will manually select the values of Central and West.
After creating the set, a new “Sets” section will appear in the data pane beneath the available measures on the left-hand side of the screen. This is where we can go to access our newly created region set. 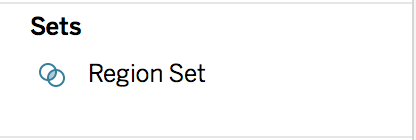
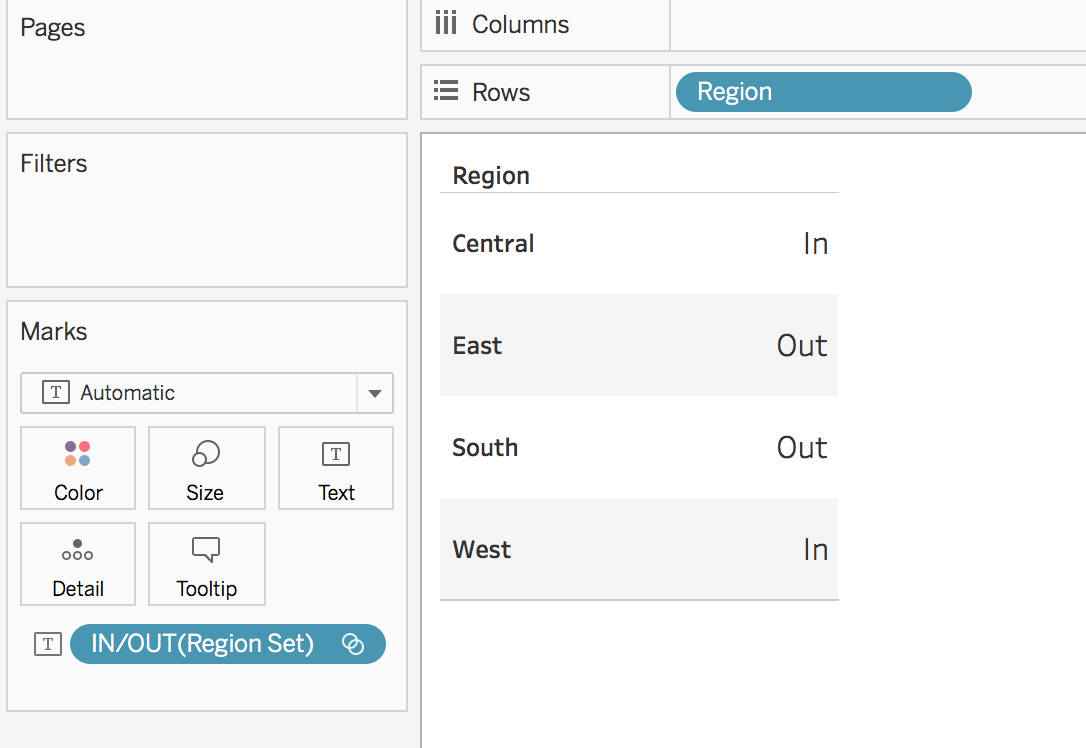
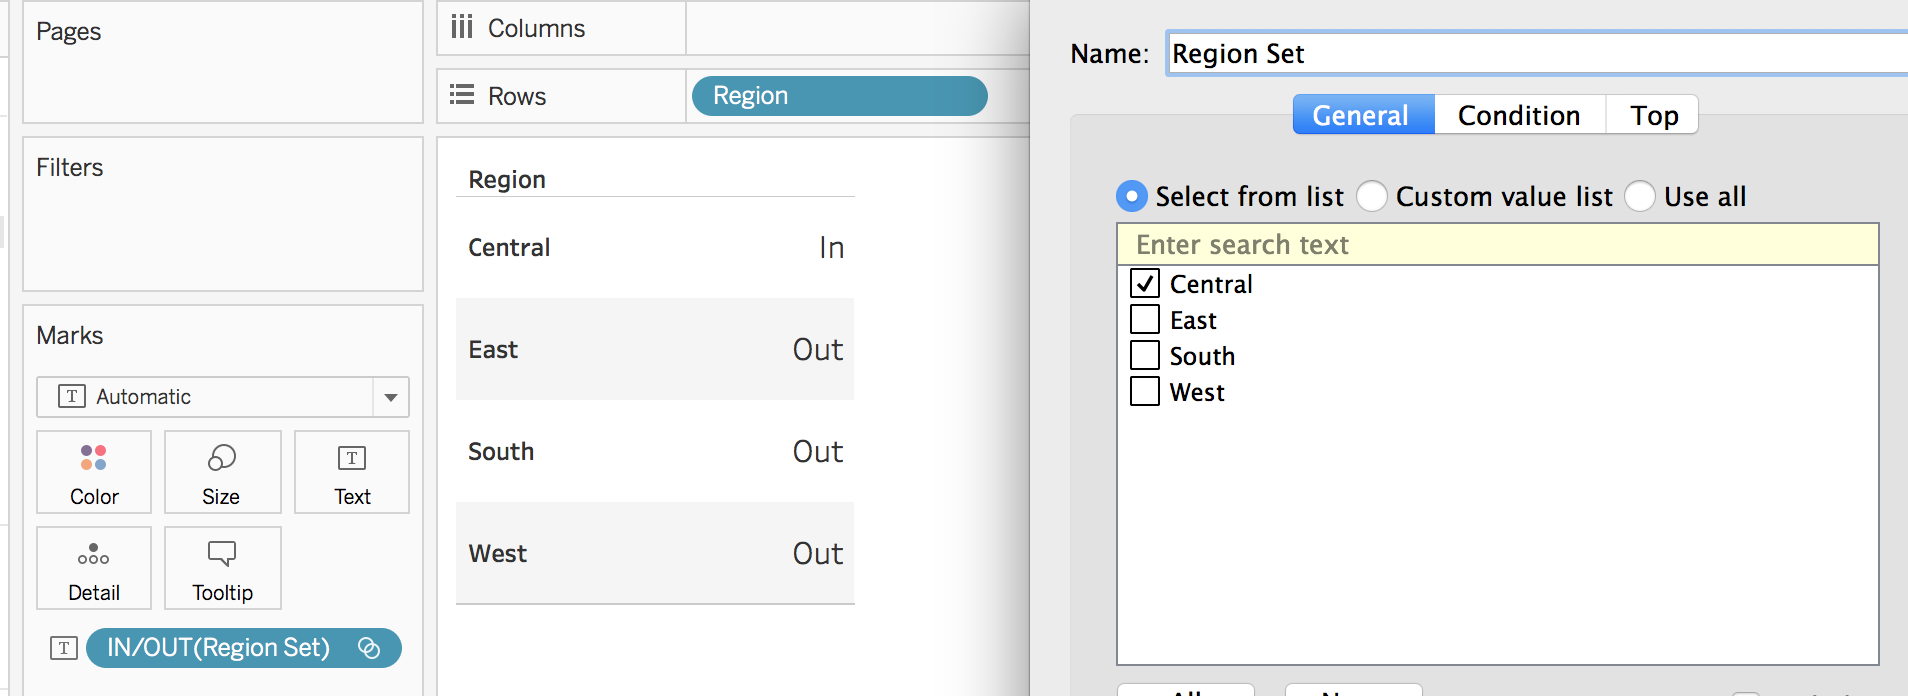
Like a dimension, a created set can be dragged from the data pane into a worksheet. For example, if we create a new worksheet and add the region dimension to the rows shelf, we can then drag the Region Set from the sets pane onto the text mark. The result is that for each member of the region dimension, we can see whether it is in or out of the set.
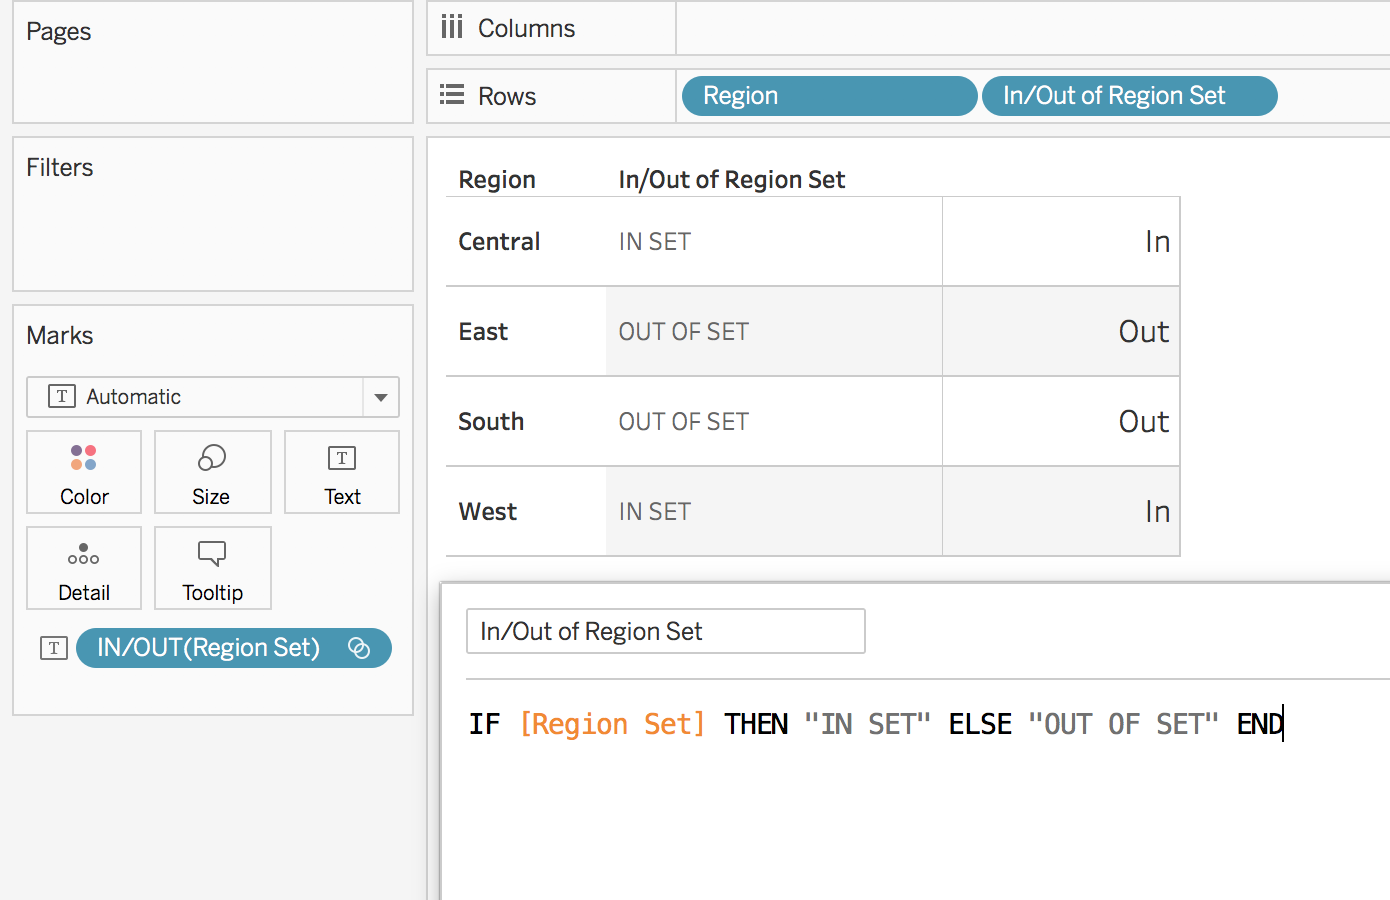
The set can also be used in calculations. Anything IN the set evaluates to True while anything out of the set evaluates to False. To use sets in a calculation, use the following syntax:
IF [Name of Set]
THEN "What to do if a value is in the set"
ELSE "What to do if a value is not in the set"
END
While there is a lot more that can be done with sets, these are the most important things to know to use set actions. If you want to learn more about sets, check out the following articles:
What are actions?
Actions allow users to interact with the content present on a worksheet or dashboard. Actions pass along a selected data point to some other part of the dashboard or workbook.
There are four different types of actions:
- filter (the value selected is used to filter specified worksheets)
- highlight (the value selected is brought to the front – highlighted – where it appears on other worksheets)
- URL (the value selected is passed into a URL, which is then executed in a new web page)
- set (the value selected is passed into a created set)
Once the desired action is selected, there are three different ways to trigger an action:
- select (clicking on a mark)
- hover (mousing over a mark)
- menu (clicking on a mark and then clicking on a hyperlink in the tooltip)
Set actions function similarly to filter actions, so let’s review the flow of how a filter action works.
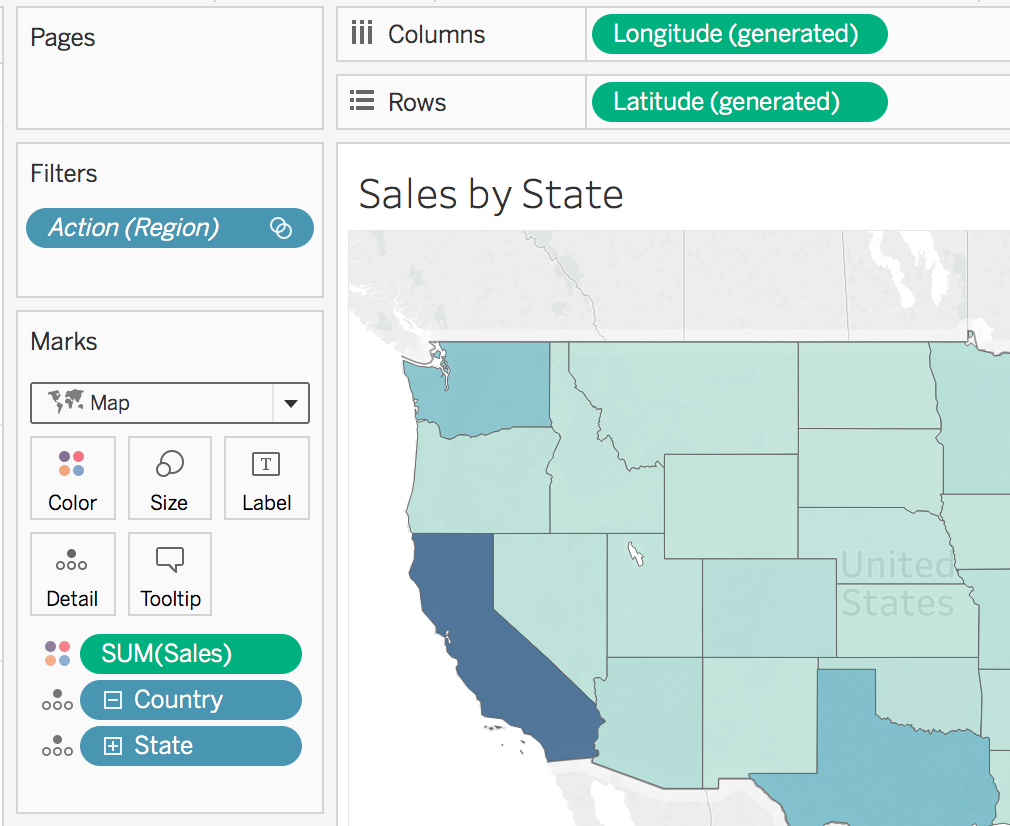
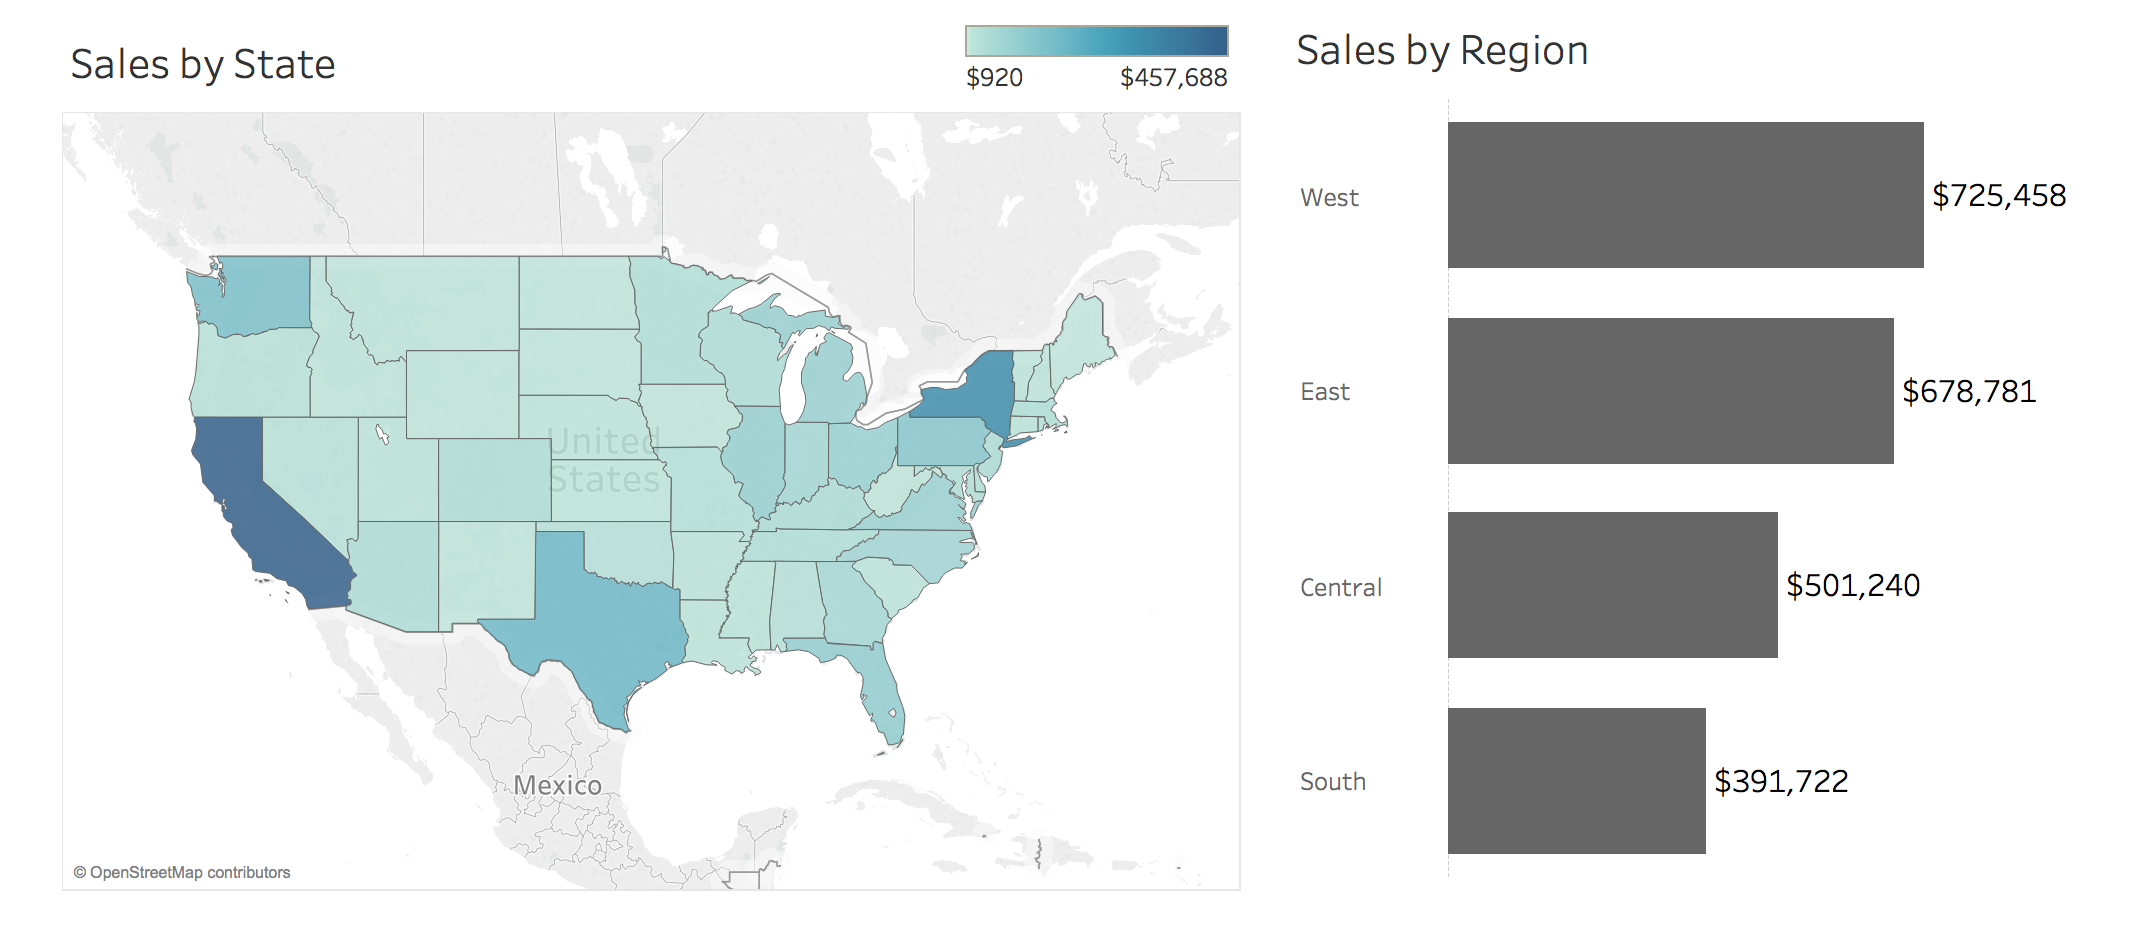
If I had the following dashboard, looking at Sales by State and Sales by Region, I could set up a filter action so that every time I clicked on the West region bar, the map on the left would filter to only the states in that region. Clicking on the East region bar would filter the map to only the states in the East, etc.
What is this filter action doing? Whatever region is selected on the sales by region bar is passed, through the action, onto the filters shelf of the Sales by State worksheet.
What are set actions?
As I previously mentioned, sets place members of a dimension into one of two groups, IN the set or OUT of the set. Actions pass values from a selected data point into some other component. Set actions then, allow users to dynamically update which members are in a set through interacting with a data point. When a mark is clicked on, instead of the dimension member (such as West) being passed to the filter shelf, the member is passed into the set. The new dimension member(s) being passed into the set, replace whatever member(s) were in the set previously. Before set actions, there was no way for the user to change what values were in the set. However, now that it is possible to change the set within a dashboard, a whole new world of possibilities exists.
Let’s revisit the Region Set we created earlier and add a set action to the worksheet to allow the user to choose which regions to include in the set.

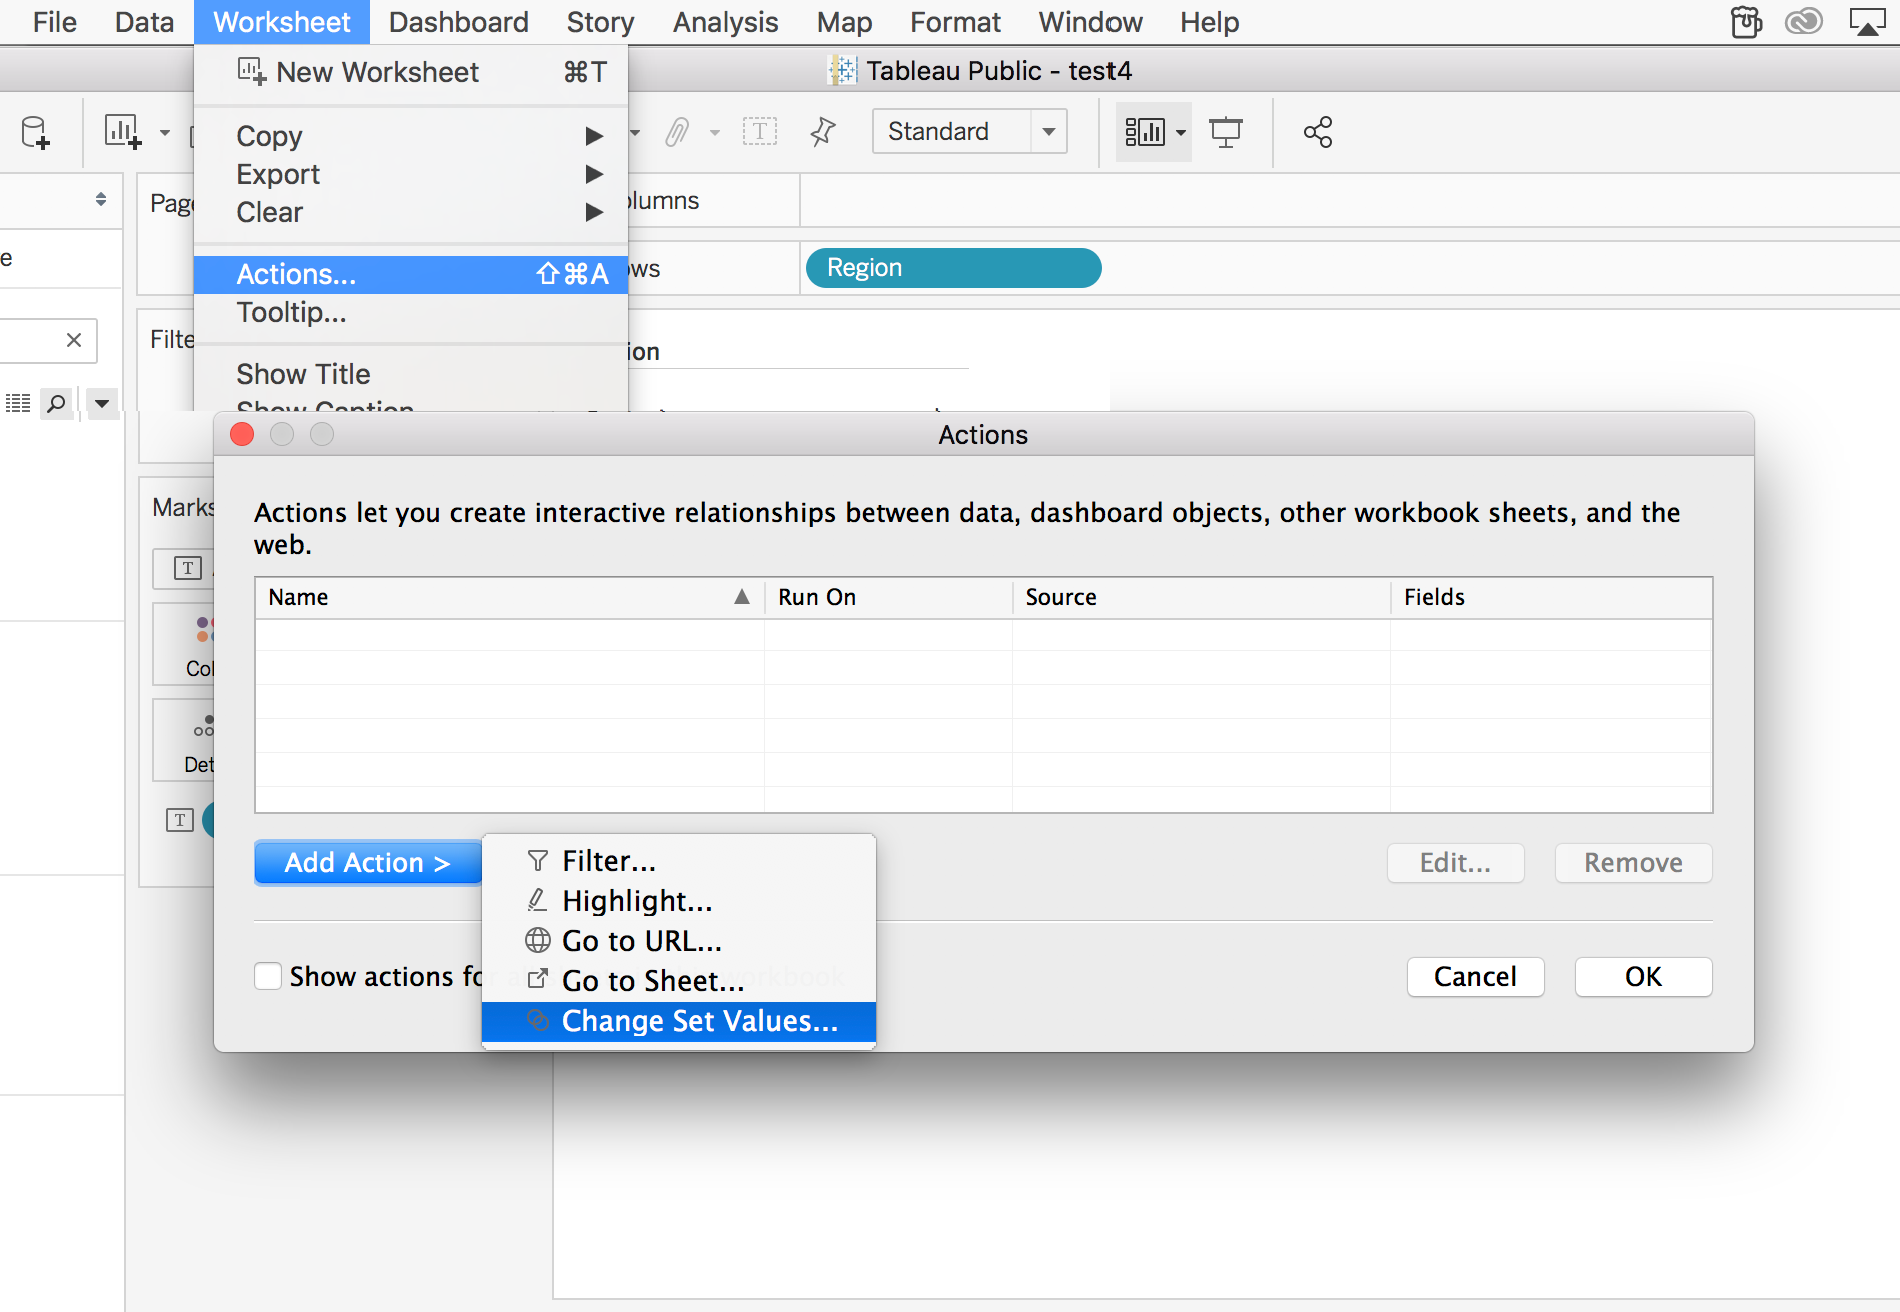
To create a set action, go to worksheet > actions > add action > change set values.
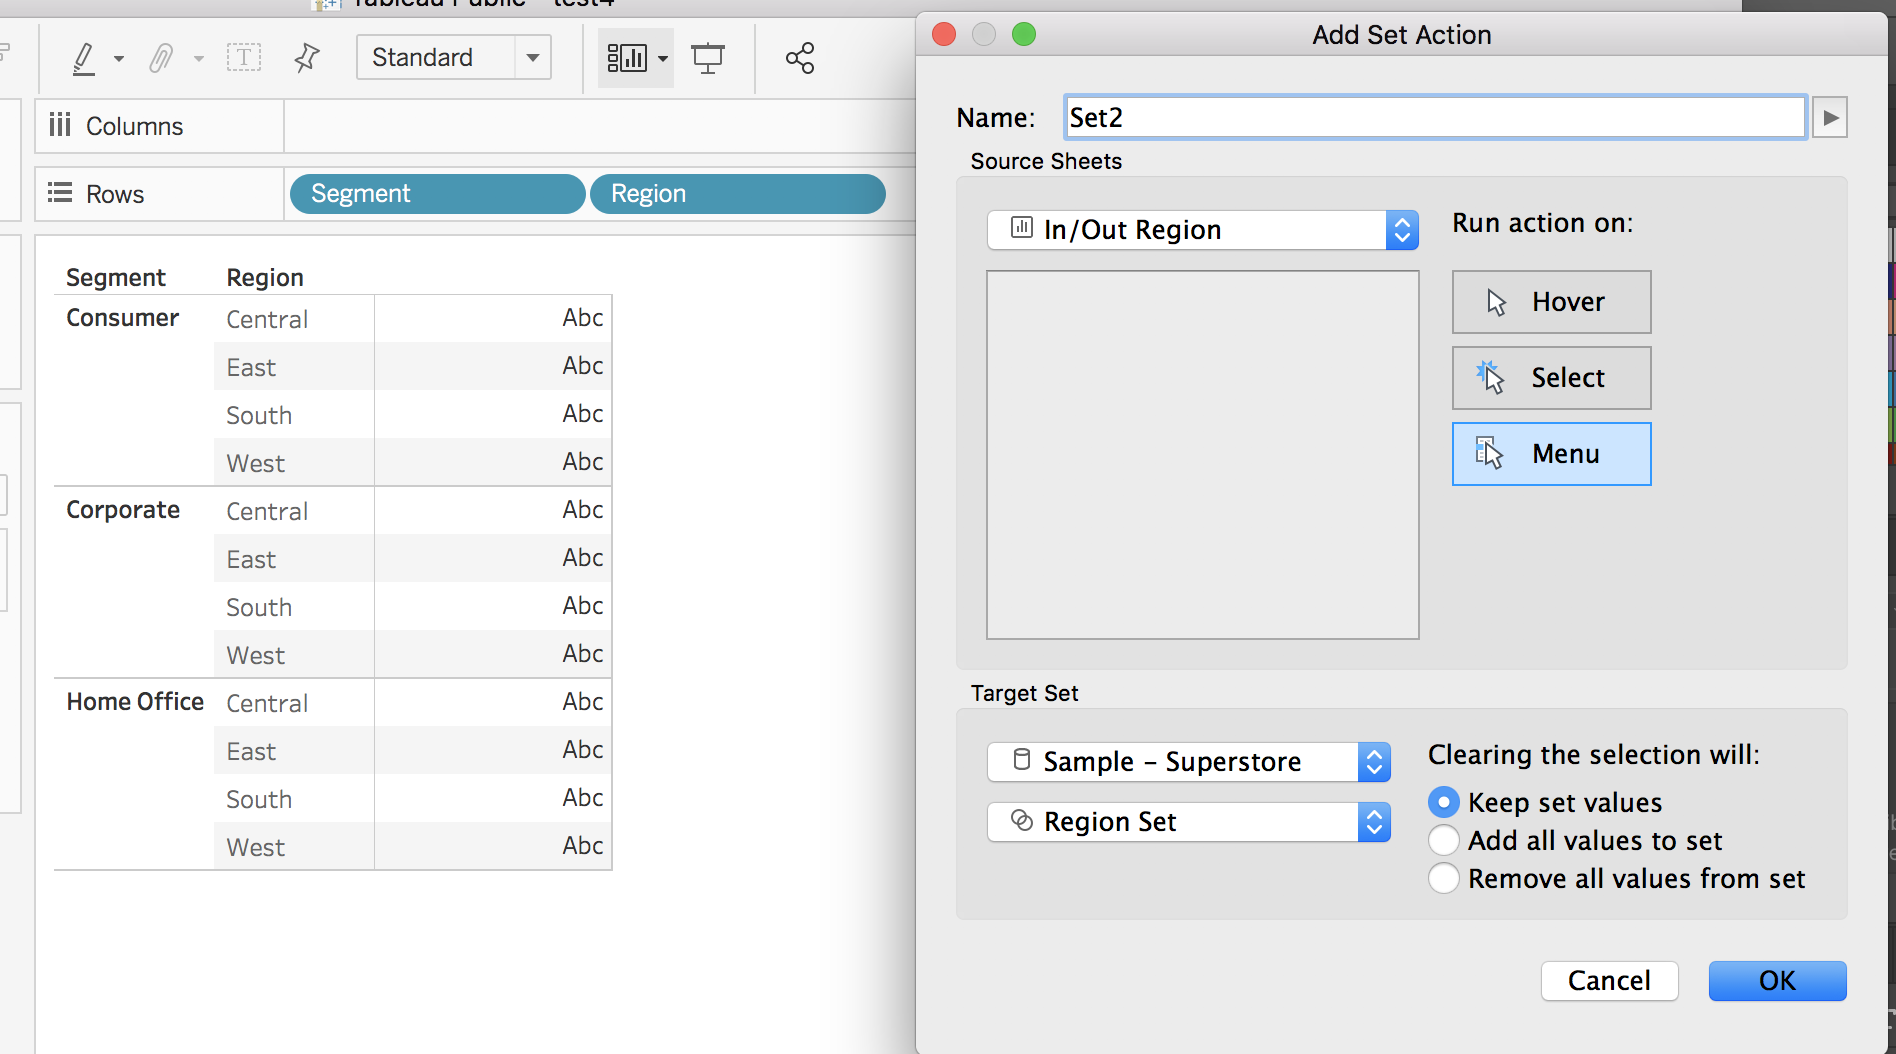
The set action dialogue looks like the following:
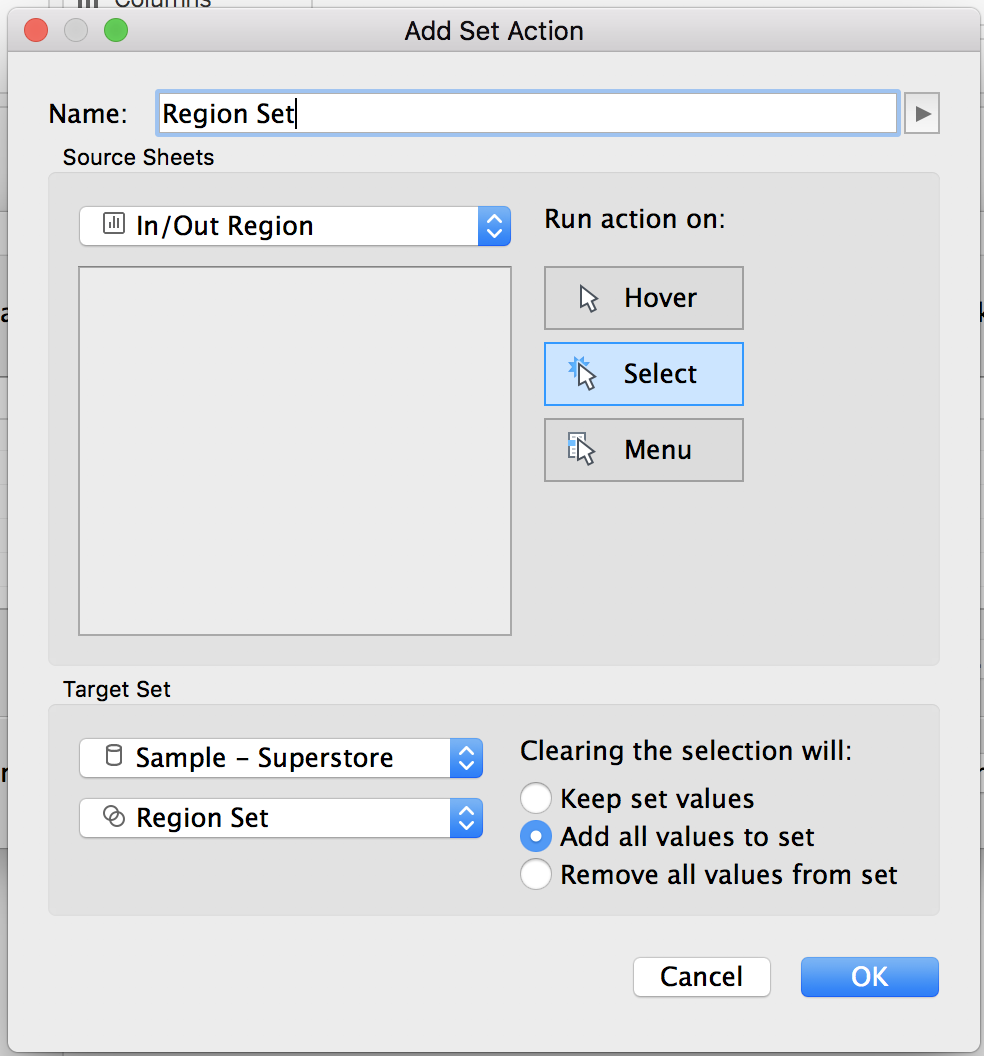
The following items need to be thought through when determining how to configure a set action:
SOURCE SHEETS:
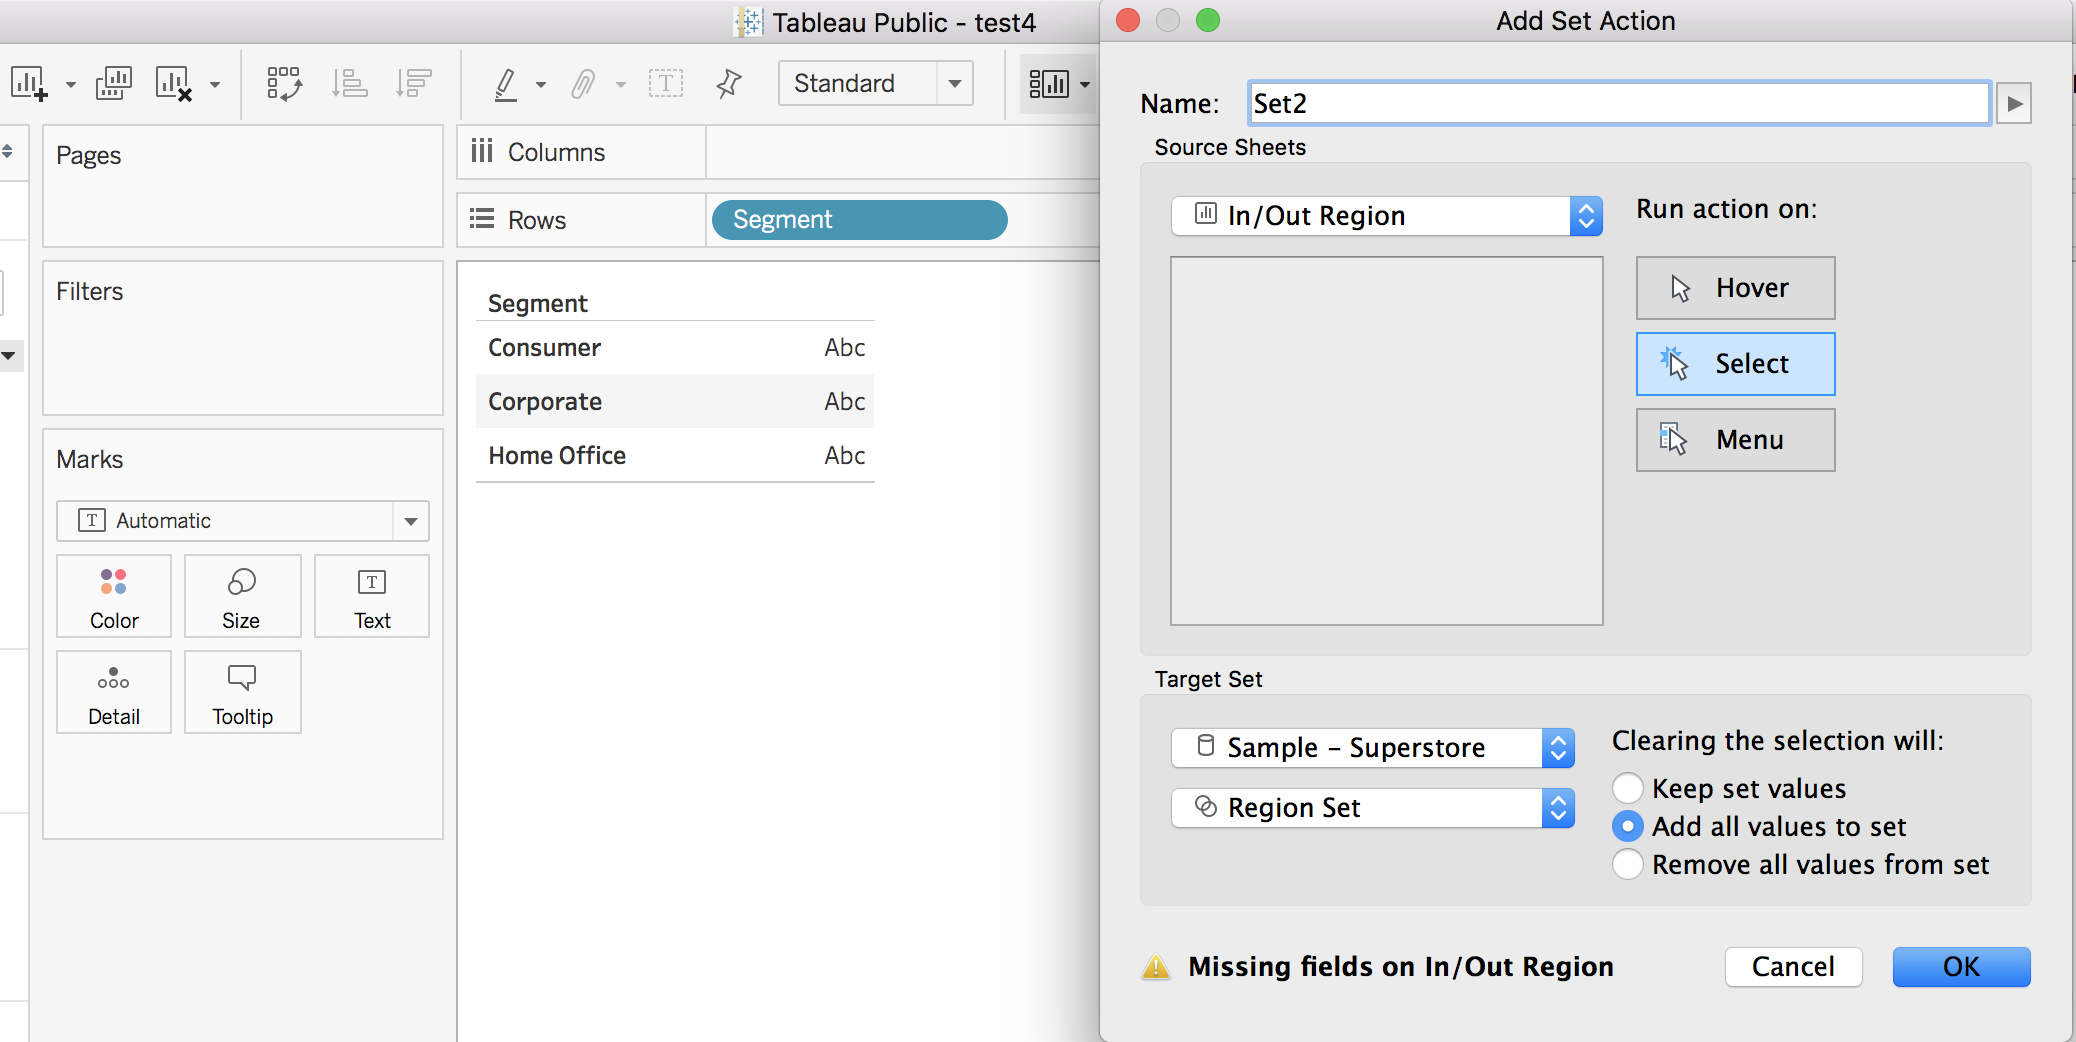
- Where should the action be run? Like filter actions, you have to choose which worksheets or dashboards the action should run on. Should it only run on a specific dashboard? Should it run on only a worksheet? Should it run on both? For this example, we want the action to run only on the worksheet Sales by Region (In/Out Region in my screenshot).
- How should the user activate the action? Like filter actions, you have to choose if the action will be run when clicking (selecting) on a mark, hovering over a mark, or through a menu that appears in the tooltip after clicking on a mark. For this example, we want the action to run upon selecting (clicking).
TARGET SET:
-
- What set should be updated/changed? Specify which data source the set is created on followed by the name of the set to use. In this example, we are using the Sample – Superstore data and the set is called Region Set.
- What should happen when the user clears the selection? What is selected for this portion has the most impact over how the set action will operate. So, let’s do a deep dive into each of the options. First off, what does “clear the selection” even mean? This depends on how the action is run.If select is chosen, when the user clicks on a mark, the mark is highlighted and the other values dim. Clearing the selection refers to what happens when the user deselects a mark (by clicking on again), returning the visual to normal. In this example, clicking on a region of West will add West to the set. The question we need to answer is: what should happen when the user deselects West?
 If hover is chosen, when the user mouses over a mark (and a black border appears), the dimension member will be added to the set. Clearing the selection refers to what happens when the user moves their mouse and is no longer hovering over the dimension member. In this example, hovering over a region of East will add East to the set. The question we need to answer is: what should happen when the user is no longer hovered over East?
 If menu is chosen, when the user clicks on a mark, a tooltip will appear with a hyperlink. Clicking on the hyperlink will add the dimension member to the set. Like actions run on select, the mark is highlighted and the other values dim. Clearing the selection refers to what happens when the user deselects a mark (by clicking on what is blue), returning the visual to normal. The question we need to answer is: what should happen when the user deselects West?
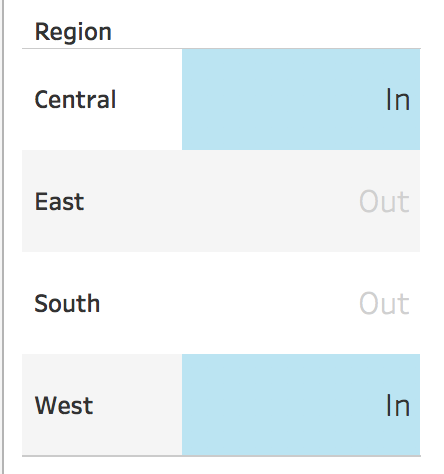
Now that we know what clear the selection is referring to, what are the options to answer the questions posed above? There are three options for what to do when a mark is cleared, like those on filter actions. If we look at our worksheet, clicking on Central will add it to the set.
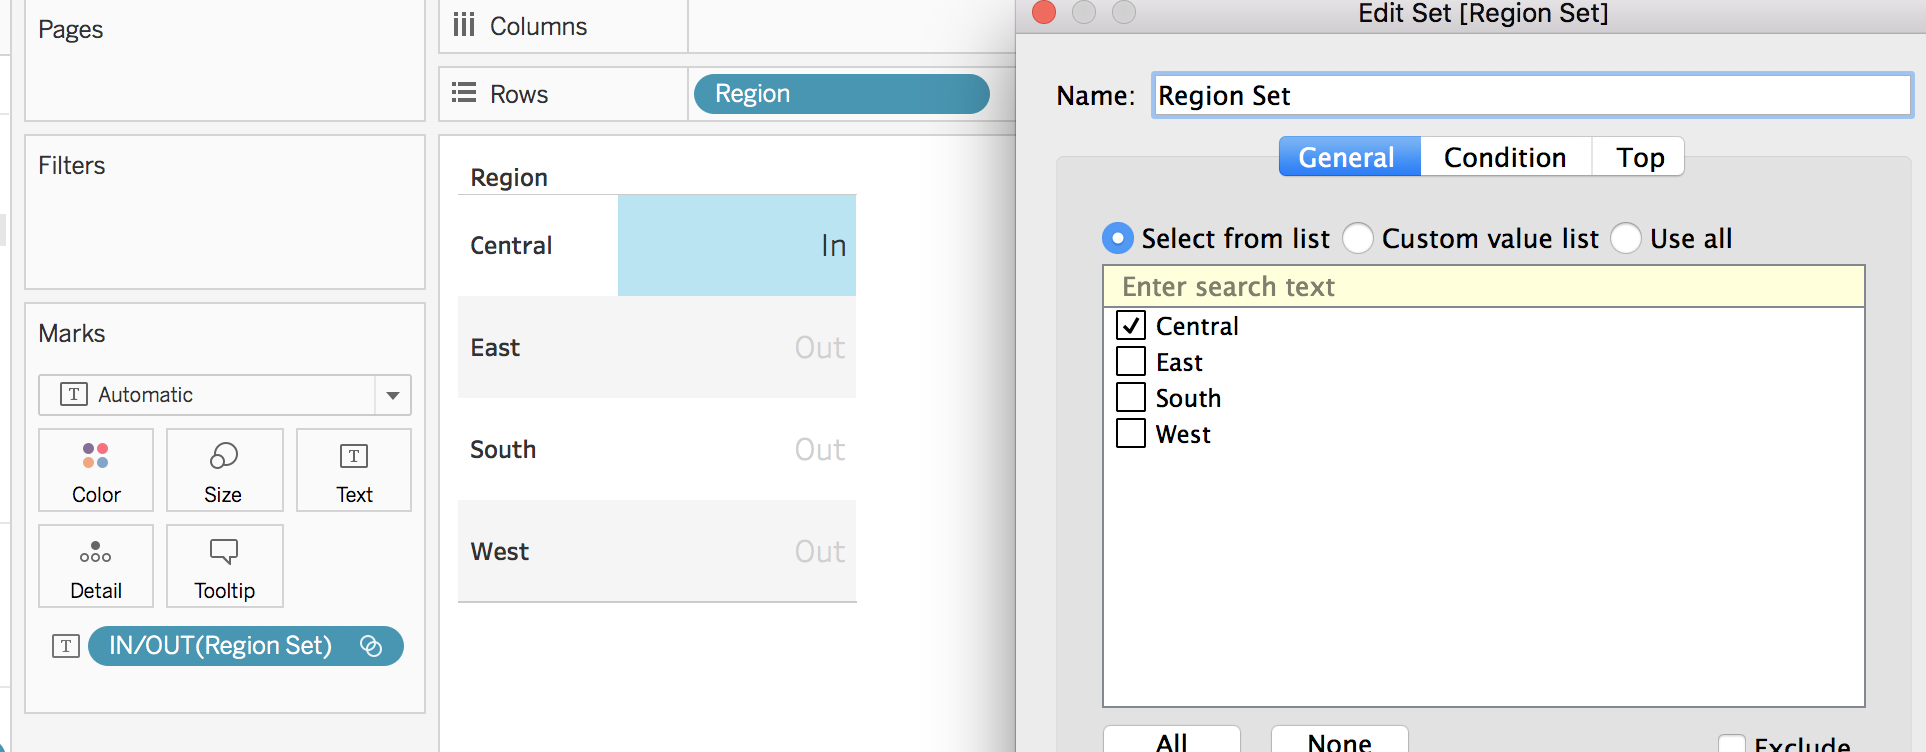
When clearing the selection is set to keep set values, deselecting Central does not change the set in any way. Central will stay in the set until another mark activates the set action.
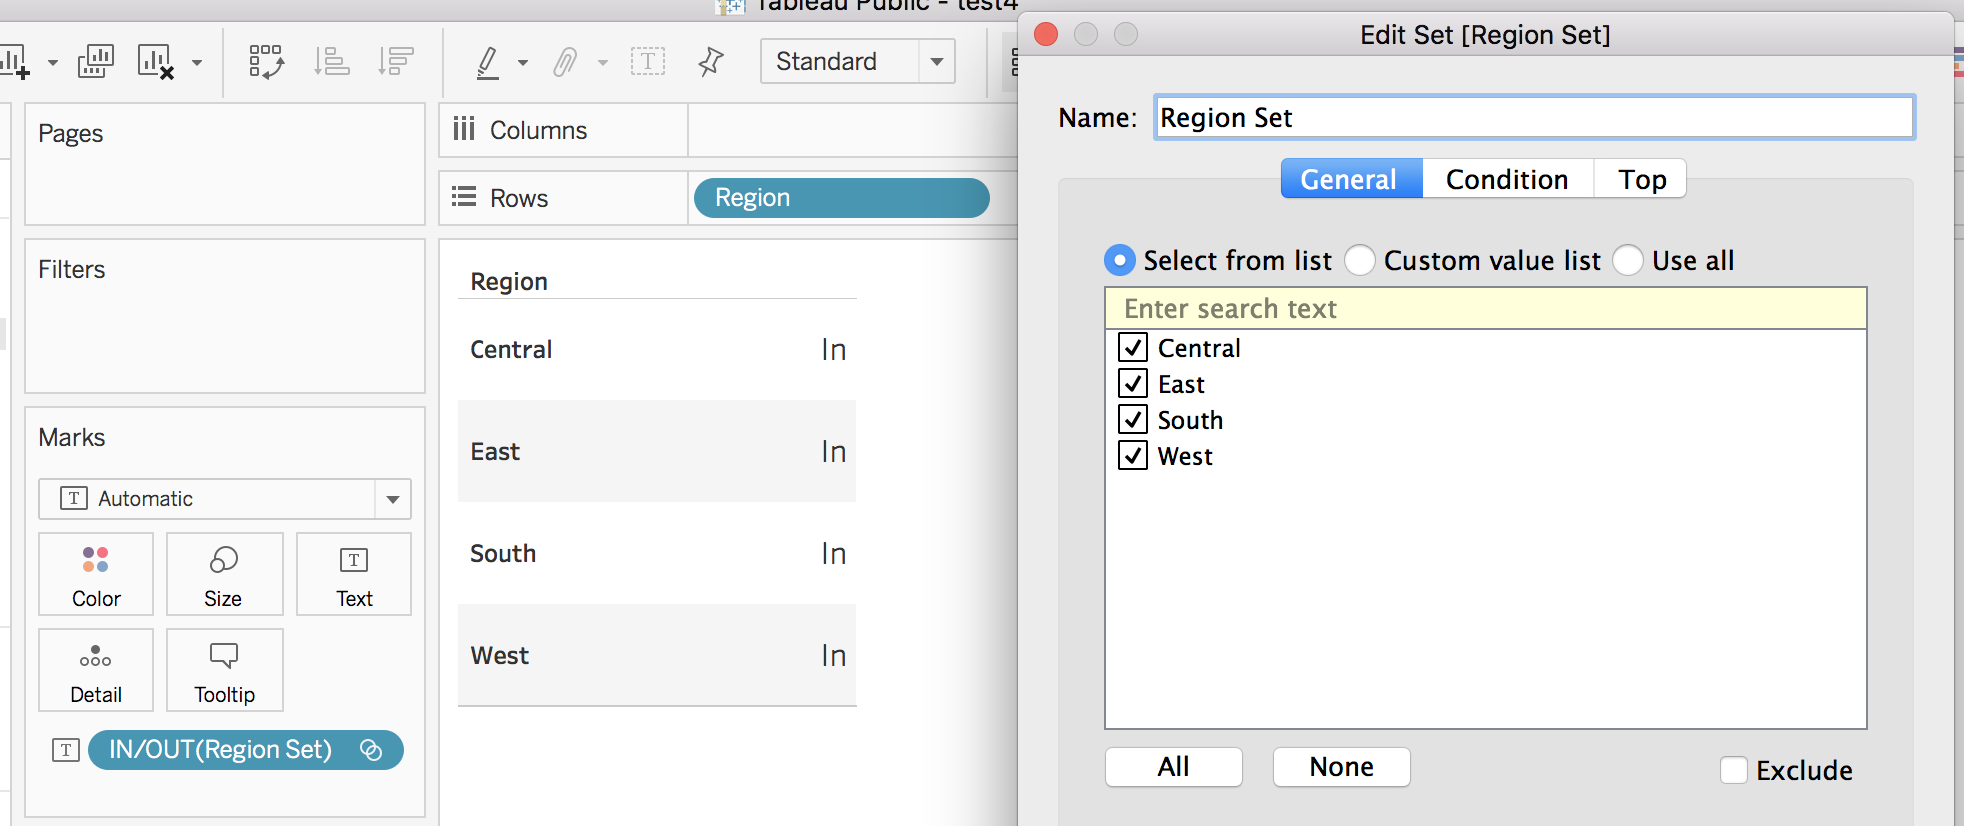
When clearing the selection is set to add all values to the set, deselecting Central adds all regions into the set. Every region is IN the set.
When clearing the selection is set to remove all values from set, deselecting central removes all values from the set. Every region is OUT of the set.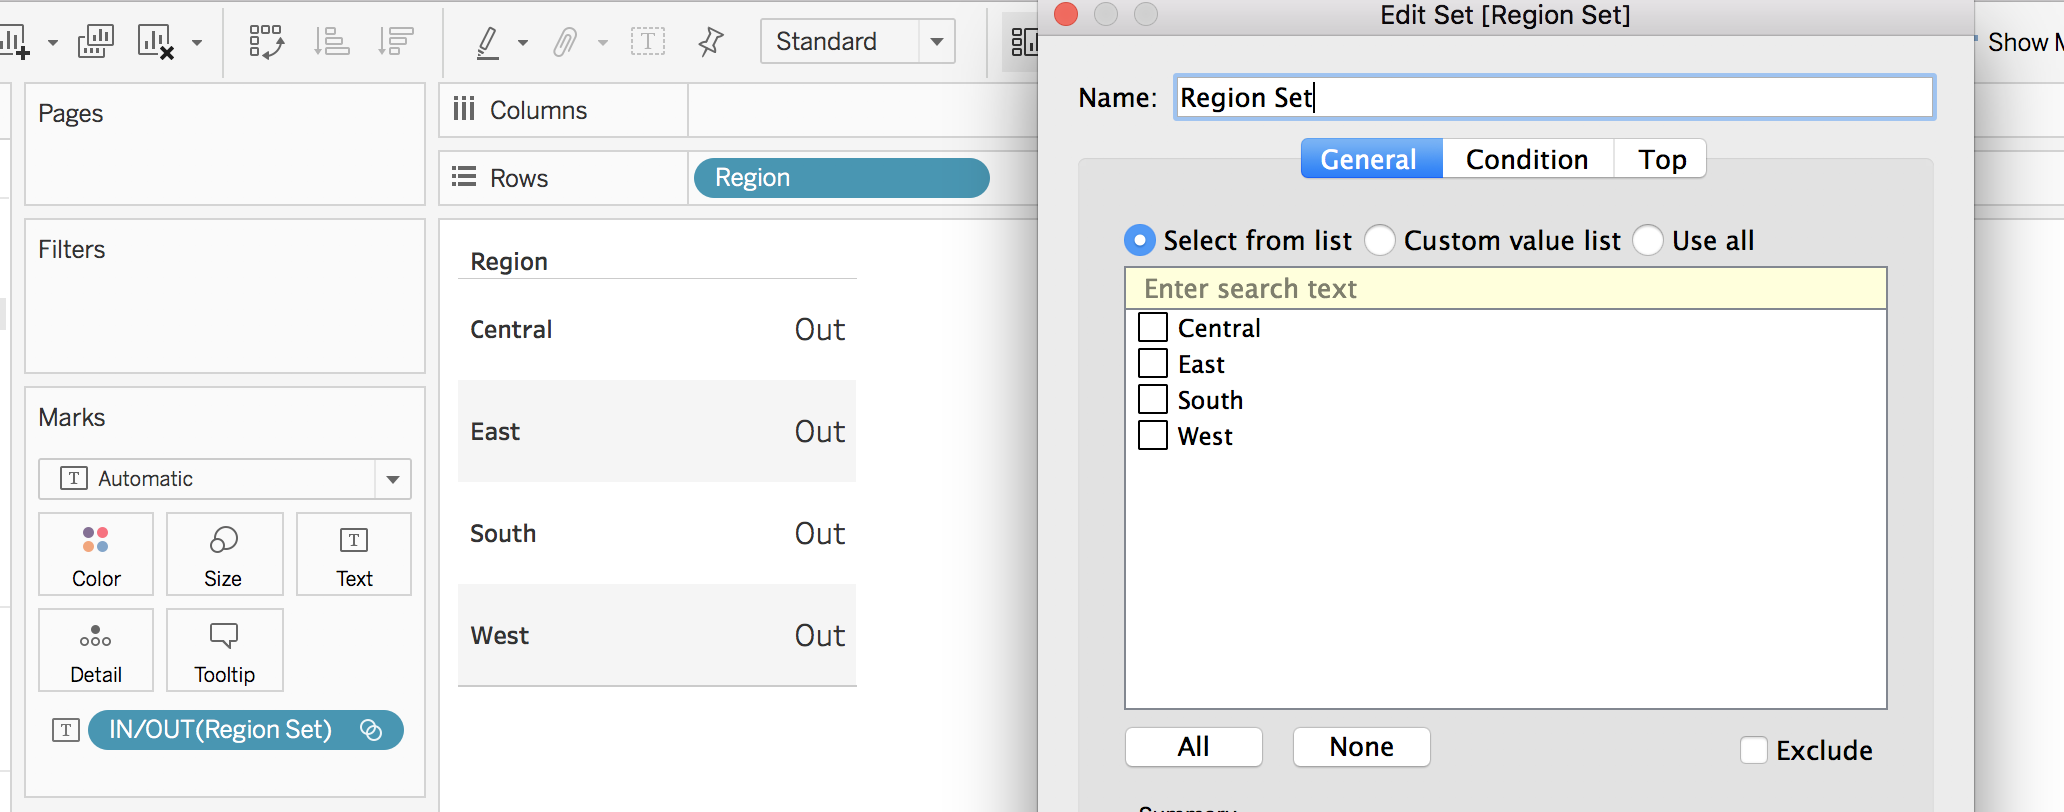
To recap: clearing the selection refers to what should happen to the set when the user deselects a mark (run action on select and menu) or when the user moves their mouse to no longer hover over a mark (run action on hover). The options include:
- Keep set values (a value stays in the set until another mark activates the set action)
- Add all values to the set (clearing the mark will place every value IN the set)
- Remove all values from set (clearing the mark will place very value OUT of the set)
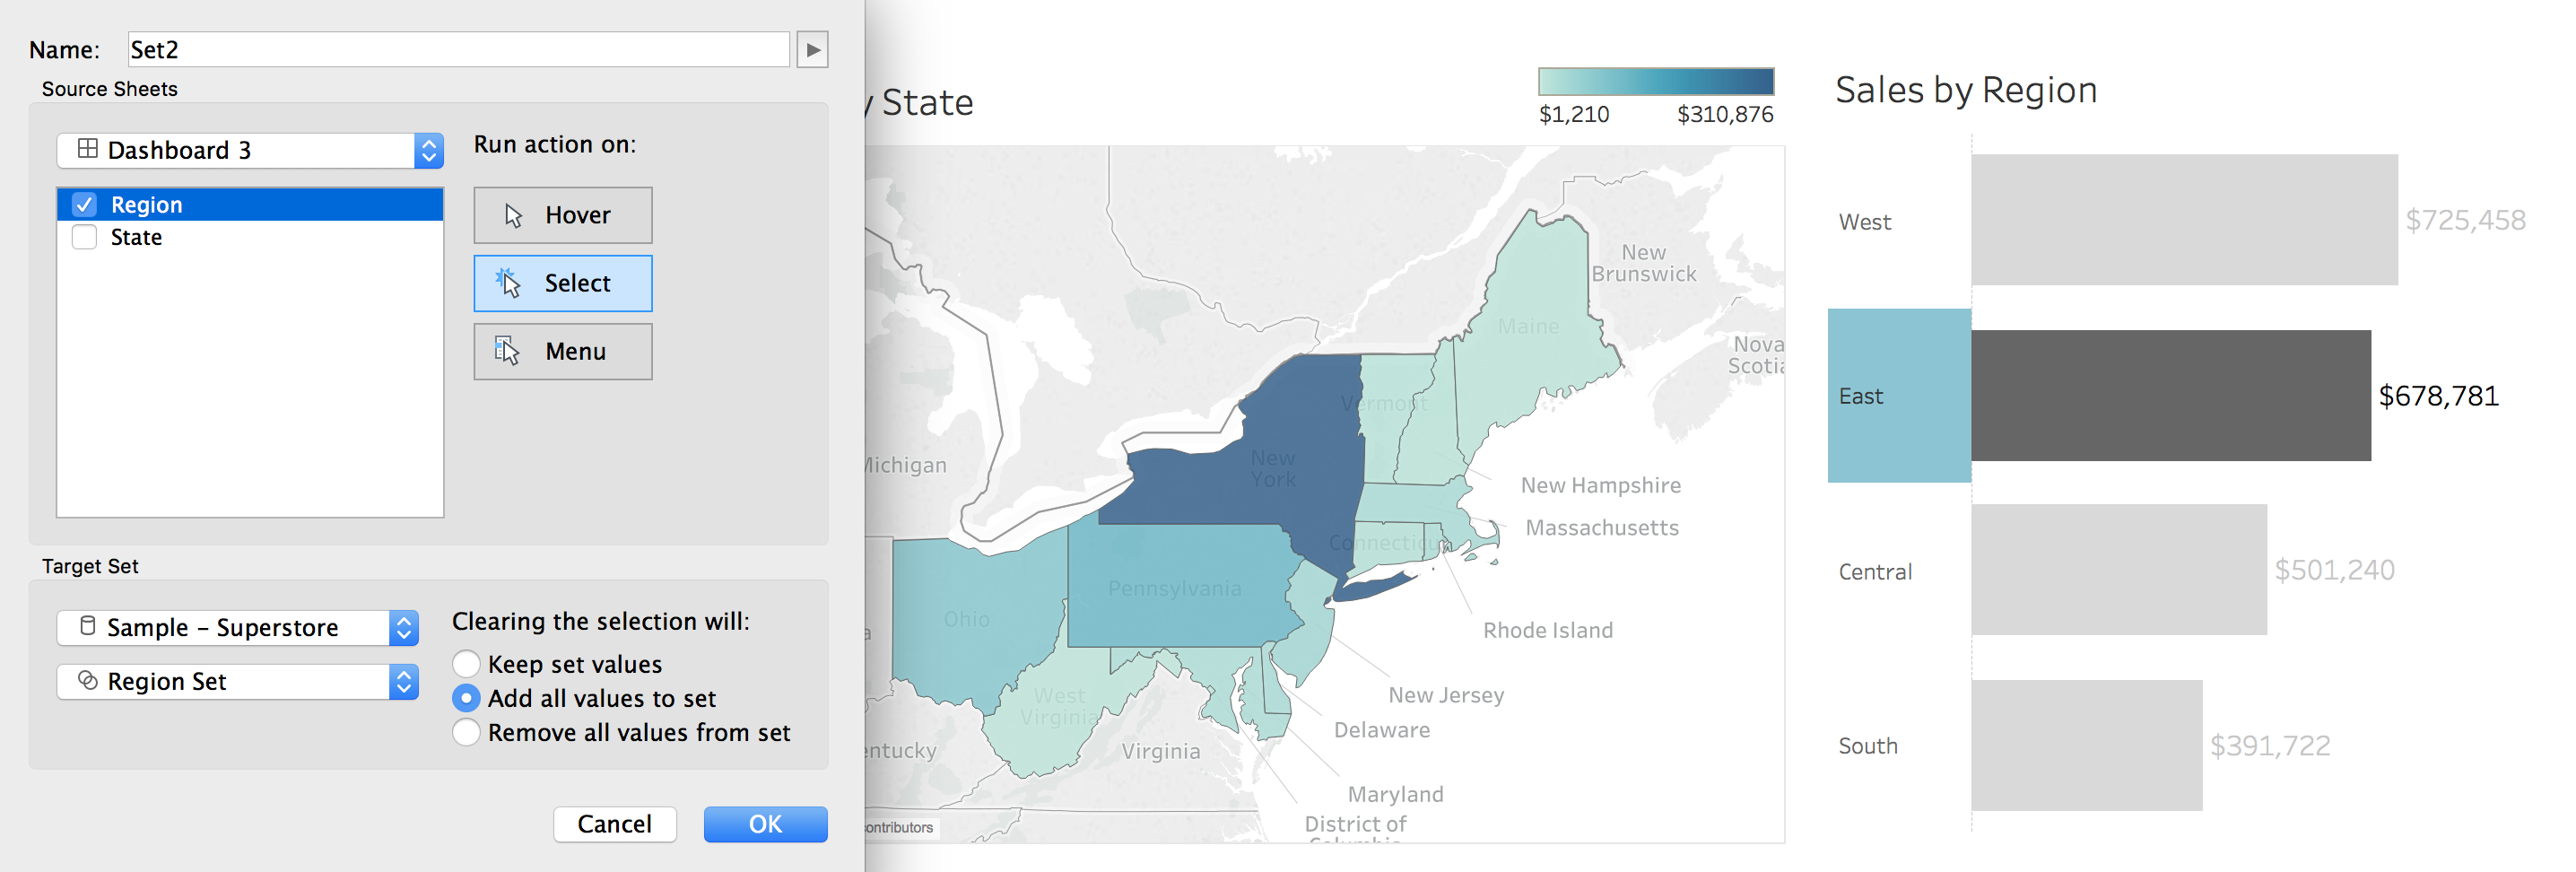
For this example, we want the action to add all values to the set when it is cleared.
After setting the action up, we are ready to test it out. Clicking on any row updates the set! Clicking on Central changes the set value to IN, with every other region having a value of OUT. Clicking on a region of South removes Central from the set and adds South. Clearing the selection, by clicking what is highlighted blue, adds every region to the set.
A few additional handy things to know when creating a set action:
Selecting Multiple Values
To select multiple values, such as to add Central and West to the set, hold down Command (⌘) on a Mac or Control (Cntrl) on a PC, and select the desired values.
Field In the View
For a set action to work, the dimension the set is created off of has to be on the worksheet. For example, the
Region Set we’ve been using is based off the region dimension. If we had a worksheet with only segment on rows, we would be unable to add a set action to update the region set. As seen below, a “missing fields” error appears.
However, as soon as we add region into the view (it can be on the rows shelf, columns shelf, or marks card), we no longer receive an error when setting up the set action.
The dimension the set is created off of (region) only has to be on the worksheet that is used to update the set action (the source sheets). The set can be used in other worksheets without the dimension the set is created off of present.
What makes set actions unique?
So, at this point, you may be thinking to yourself are set actions really any different than filter actions? Are there really that many things that can be done with a simple set? And the answer is YES!
Let’s revisit the Sales by Region and Sales by State example to better understand what makes set actions unique.
The flow of an action filter is as follows:
- Click on the West region bar
- Add the value of West to the filter shelf of Sales by State worksheet
- Filter the Sales by State worksheet to only States in the West
If we were to use set actions on this dashboard instead of filter actions, the flow would like something like this:
- Click on the West region bar
- Add the value of West to the set
- Do anything
Now, saying do anything might be a reach, but what make set actions unique is that the value of west is now stored in a variable (like a parameter). We can do ANYTHING we desire with that value. Filter actions only allow us to place the selected value on the filters shelf, but set actions allow us control over what to do with the selected value. The selected value can be placed on the filter shelf, on the rows/columns shelf, on the marks card, or even used in calculations. Let’s walk through some of the possibilities using the Sales by Region and Sales by State example. We can use the Region Set we created earlier.
Example 1: Filter the Sales by State worksheet by the selected region(s)
We can add the Region Set to the filter shelf, with a value of West in the set. This filters the map to only states in the West region.
We can then add a set action on the dashboard where every time we click on the region, it updates the set. This replicates a filter action.
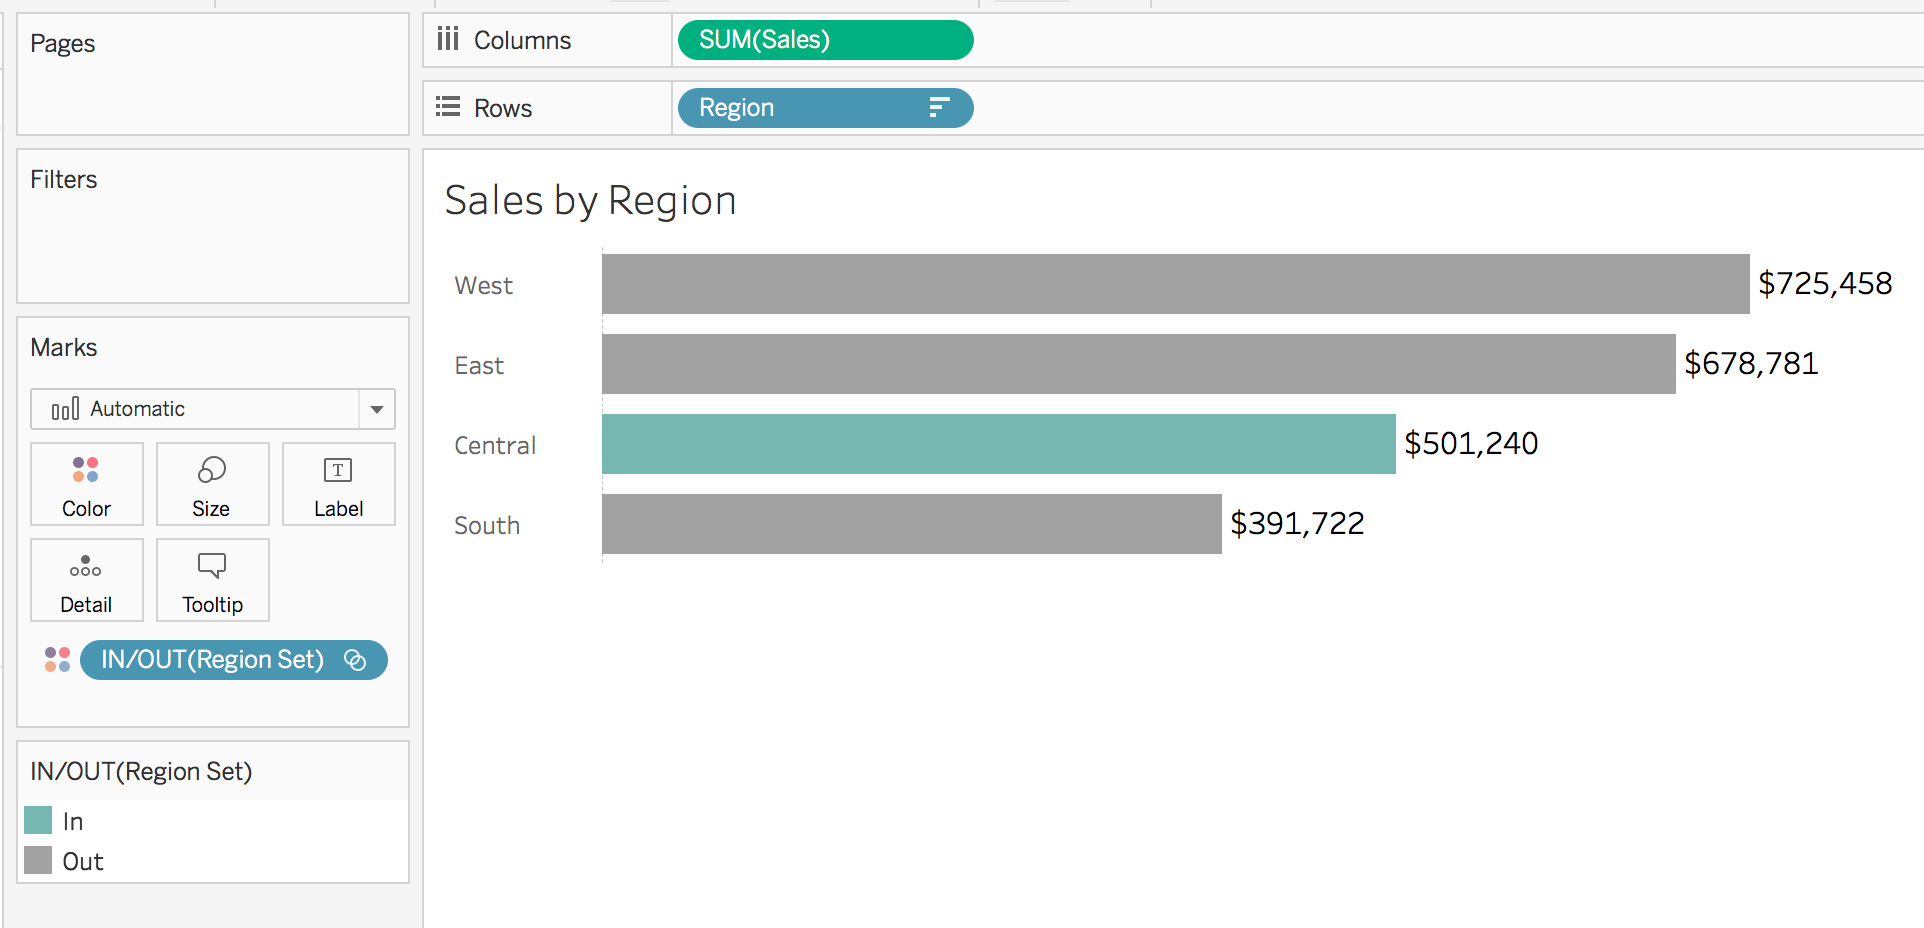
Example 2: Change the color of the selected region(s)
On the Sales by Region worksheet, we can add the Region Set to the color mark. This will allow the regions in the set to be colored differently and serve as another way to show the user what is selected.
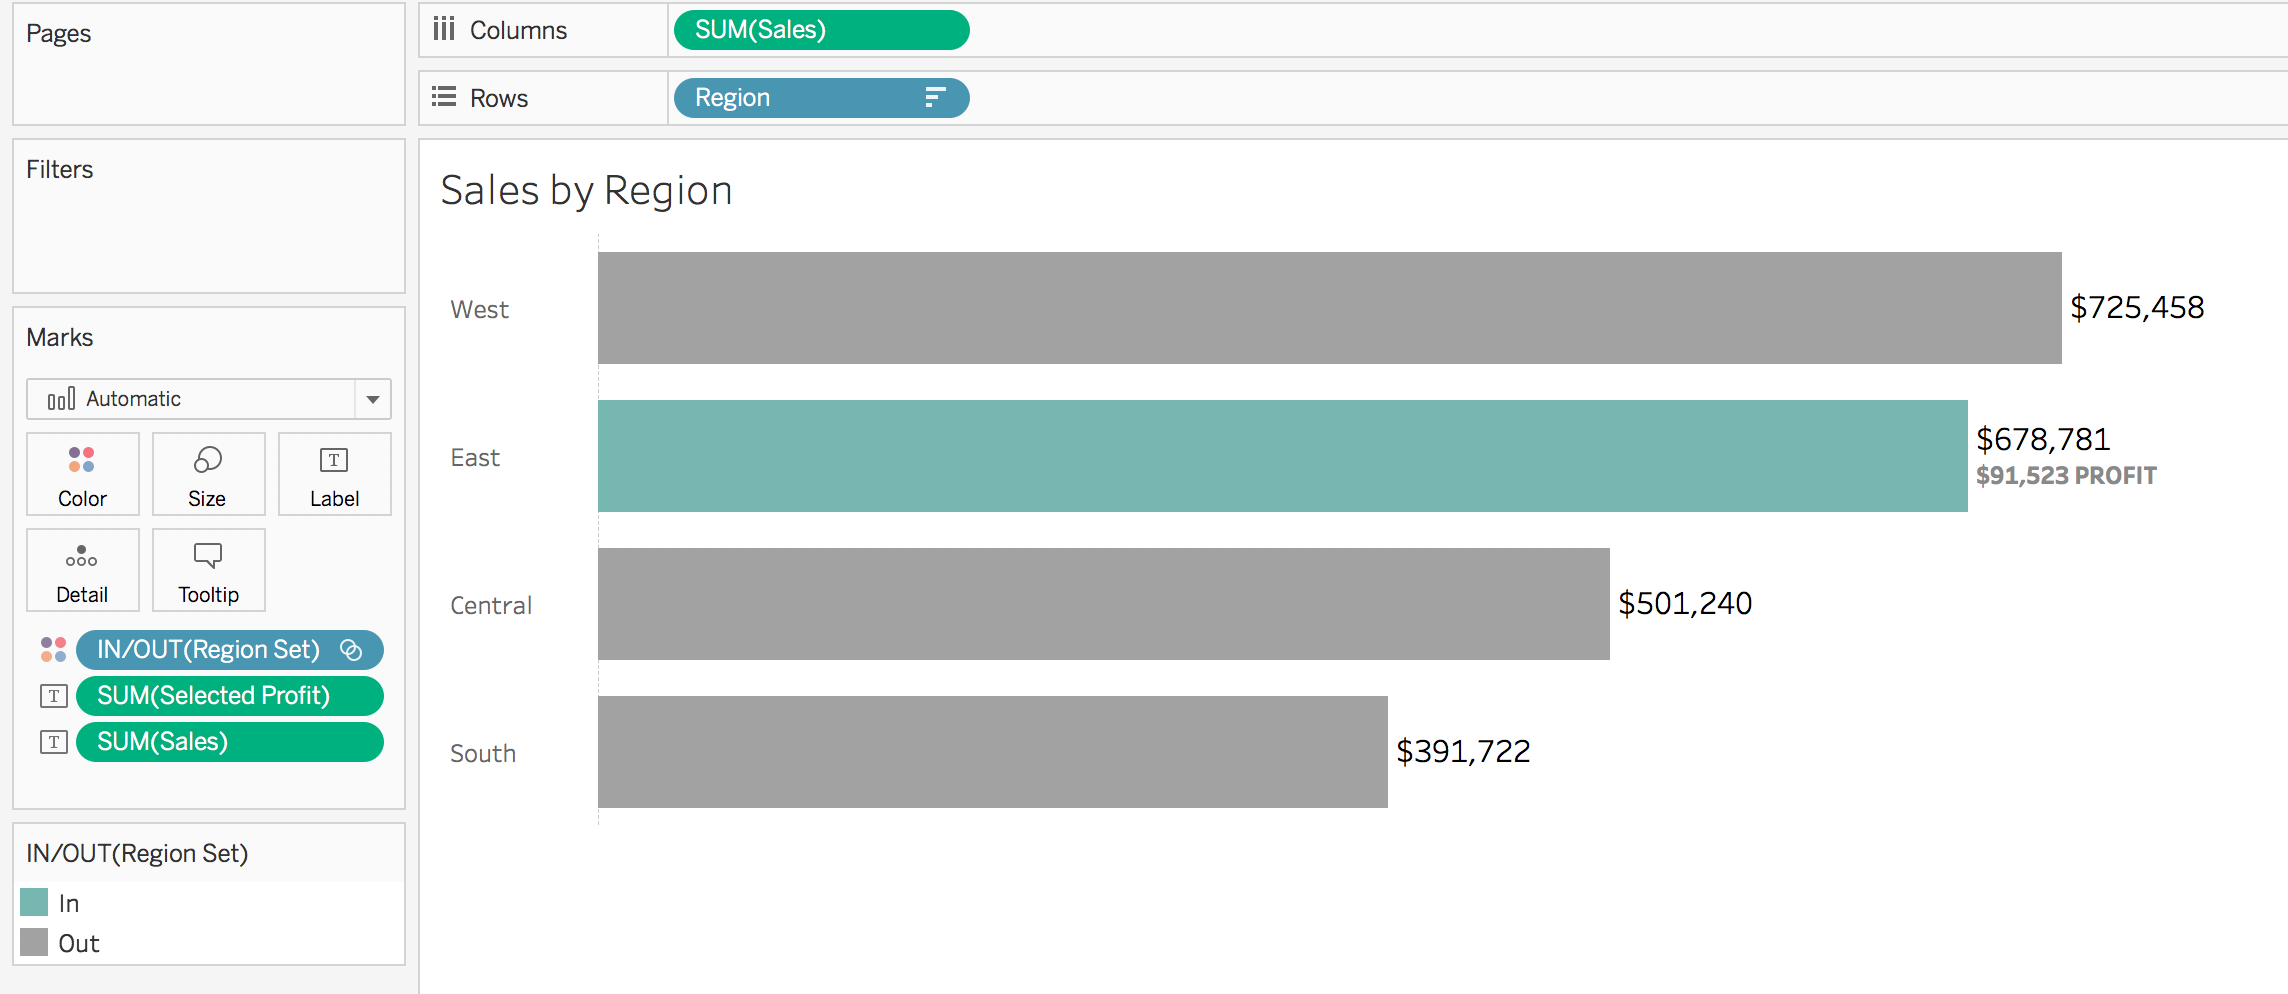
Example 3: Show the profit for the selected region(s)
On the Sales by Region worksheet, we can write a calculation so that when a region is selected, underneath the sales value is the profit value. This can be done by creating a new calculation:
IF [Region Set] THEN [Profit] END
As a reminder, the calculation is saying when a region is IN the set, show the profit value. The calculation can then be added to the labels mark and formatted appropriately:
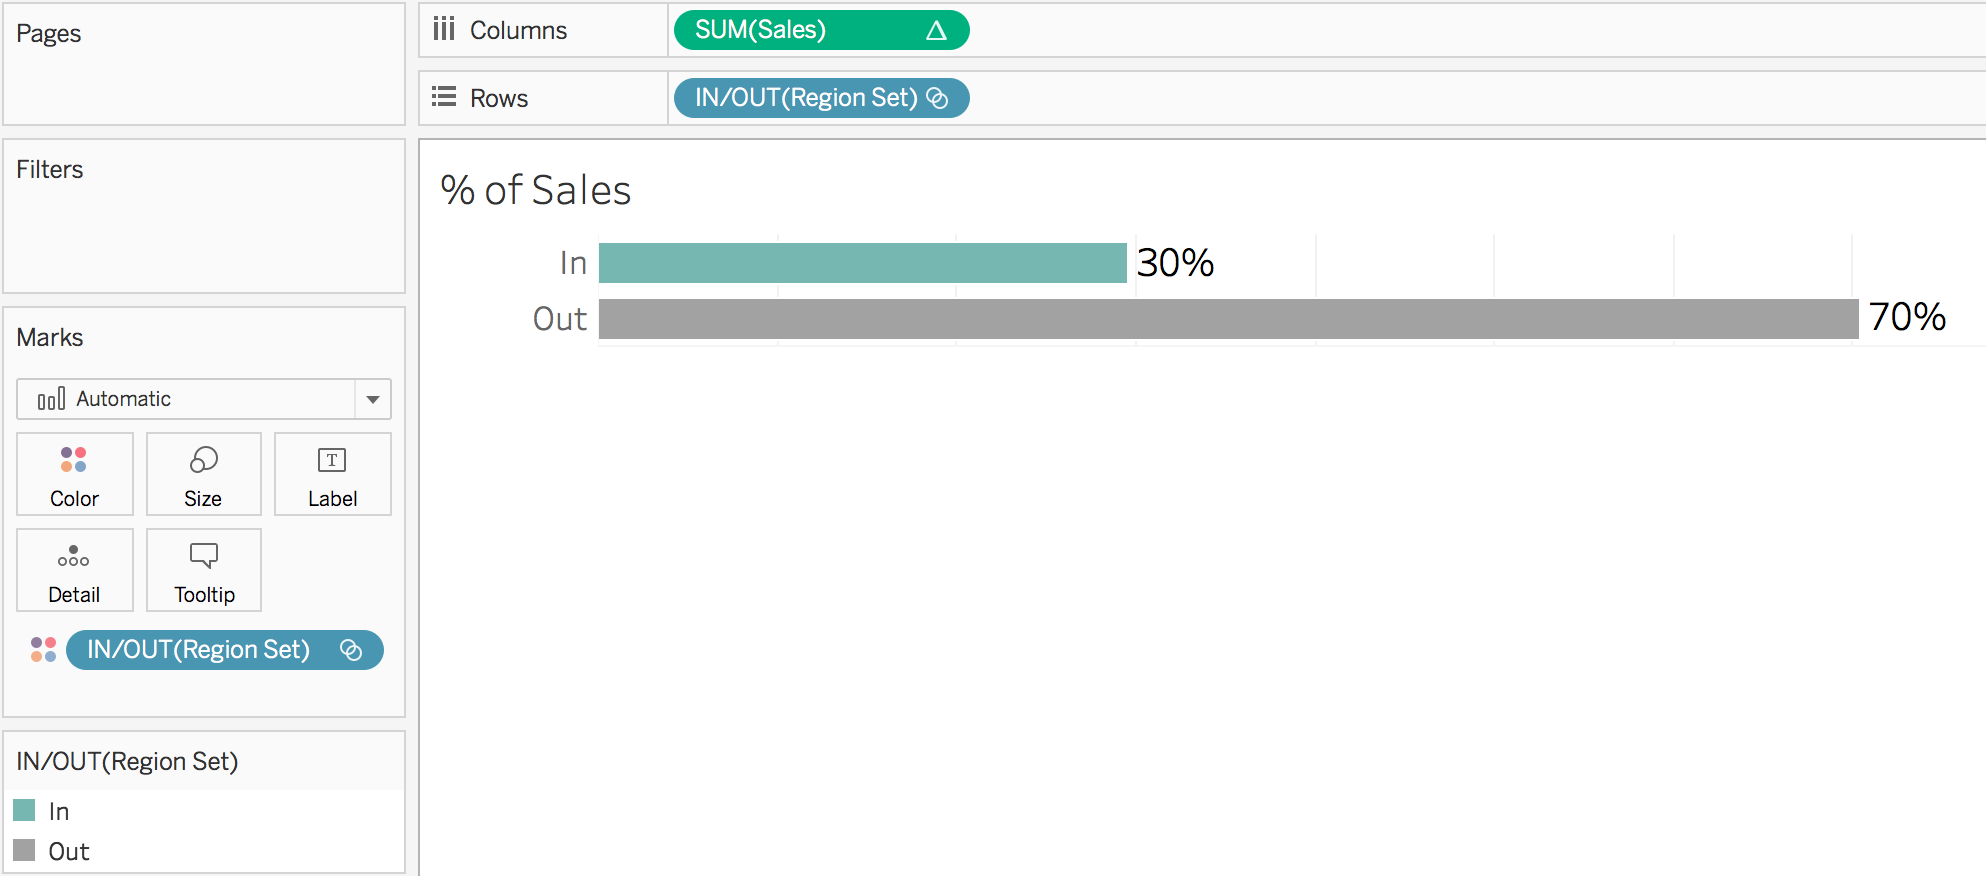
Example 4: Show the % of total sales of the selected region(s)
We can create a new worksheet by adding sales (with a quick table calculation of percent of total) on the rows shelf and region set on the rows shelf/color mark. This allows for the ability to quickly see what percent of overall sales the selected regions make up.
We can then place this on the dashboard below Sales by Region.
The four examples above combined now produce the following dashboard:
The flow for our final dashboard using set actions is:
- Click on the West region bar
- Add the value of West to the set
- Filter Sales by State to only states in the West (placing the set on the filters shelf)
- Color the West region bar blue (placing the set on the marks card)
- Show the profit amount for the West region (using the set in a calculation)
- Calculate the percent of total sales (with the set on the rows shelf)
Conclusion
Set actions are a powerful new way to enhance the user experience and formatting of your dashboard. A created set can be used as a filter, on the marks card, as a row/column, or in a calculation. Set actions now allow for the ability to dynamically update what values are in the set, which leads to immense flexibility and control over creating an interactive experience. Set actions allow the user to stay within their flow when looking at data. No need to update a filter or parameter value, the user simply has to click on what they are already looking at. Implementing set actions into your dashboards will make them more accessible and intuitive to your audience.
Here are some additional ways set actions can be used (that could never be done with filter actions!):
Drill down into values in a visualization (such as a table) [how to]
Show the underlying data points of a distribution [how to]
Use icons to add and remove values from a set [how to]
Create custom buttons to switch metrics (or dimensions) [how to]
Want to see more examples of how to use set actions? Check out my workbook on Tableau Public with 15+ different ways to use set actions or check out the other examples on my blog.