Categories
Blog Tableau

10 Reasons Why an Introvert Should Enter Iron Viz

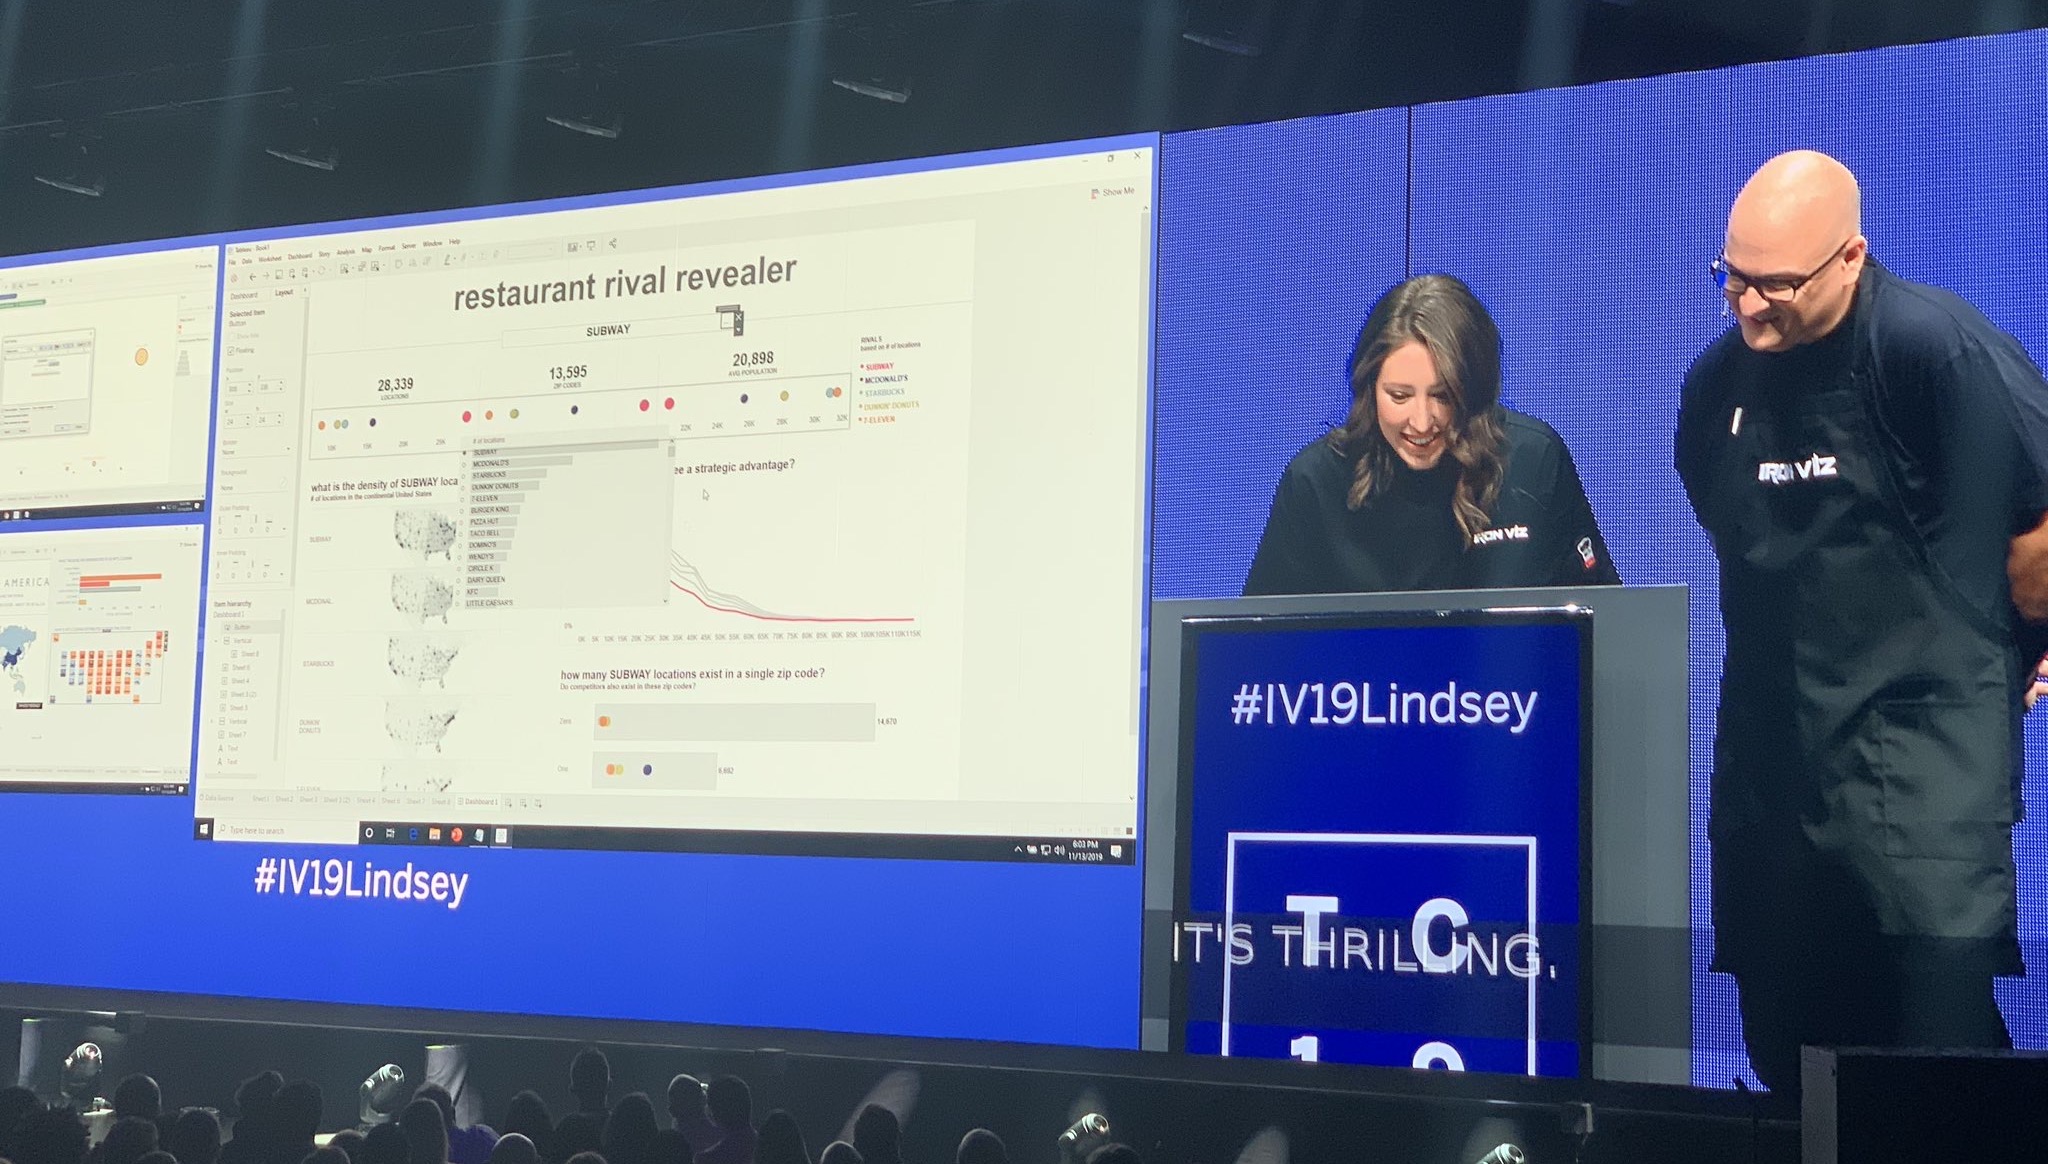
It took me five years to work up the courage to enter a feeder for Iron Viz. I never thought I would win, but the small possibility of winning was enough to keep me away. I knew technically speaking I could build a viz in 20 minutes, but the idea of having to present it […]

Categories
Blog Tableau

Custom Dropdown with Parameter Actions & Show/Hide Container

In my 2019 Tableau Iron Viz entry, I wanted the end user to be able to select a brand to understand its particular location strategy. I also wanted the ability to compare the selected brand to its rivals. The best way to achieve this was through using a parameter. However, the dataset included 922 unique […]

Categories
Tableau

The Emotional Valence of Broadway

How does the sound of a Broadway musical change from the opening number to the finale? As characters undertake, and sing through, their journey what range of emotions are projected? To find out, every track from the cast recording of each of the 22 Broadway musicals currently playing was analyzed using Spotify’s valence score. Recognition: Iron Viz

Categories
Tableau

Tony Award for Best Musical

How many total Tony nominations did each of the five Broadway shows up for Best Musical receive? Are the results from Chita Rivera, Drama Desk, Drama League, New York Drama Critics’ Circle, and Outer Critics Circle awards a good indicator of who will win the Tony?

Categories
Tableau

Oscar Watch

Which movie will take home the Oscar at the 2019 Academy Awards for Best Picture? This visualization explores how the eight movies nominated for Best Picture have performed so far in awards season, in the box office, and with fans/critics.

Categories
Blog

My 2018: A Hand-Drawn Data Viz

2018 has been quite the year for me personally and professionally. In May I accepted a remote Tableau developer position with one goal in mind: travel to different cities and decide where I wanted to move to. I fell in love with New York City and am planning on moving there in January (and as you can […]

Categories
Blog Tableau

On Your Marks, Get Set, Go: Everything You Need to Know to Get Started with Set Actions

Special thanks to Justin Davis, Michael Sandberg, Ryan Hall, Mark Bradbourne, and Matt Chambers. Set actions, released in Tableau 2018.3, are one of the most powerful new Tableau features since Level of Detail (LOD) expressions. Prior to their release, I had never used sets before. So, it took me a while to wrap my head […]

Categories
Blog Tableau

How to Switch Metrics (or Dimensions) Using Set Actions

I previously wrote about how to change dimensions using set actions. However, I have since found a better, easier way that can work for metrics OR dimensions. Previously, you had to unselect a value before selecting the next. This method does not require that! This can be extended even further to add text for additional insight or […]

Categories
Blog Tableau

Rotate Images Using Set Actions

Image sliders or carousels are common features on webpages. Using Tableau set actions, transparent worksheets, and background map images, it is possible to cycle through a set of images. Clicking on one image brings up the next. Once the last image is shown, clicking on it automatically takes you back to the first. Navigation can be […]

Categories
Blog Tableau

Select Multiple Items Using Set Action Menus

In Tableau, to add multiple values from a table or any visualization to a set action, the user has to hold down command (on a Mac, control on a PC) while clicking all the options they want. But what if you want the control the number of items a user can select? Or you don’t […]