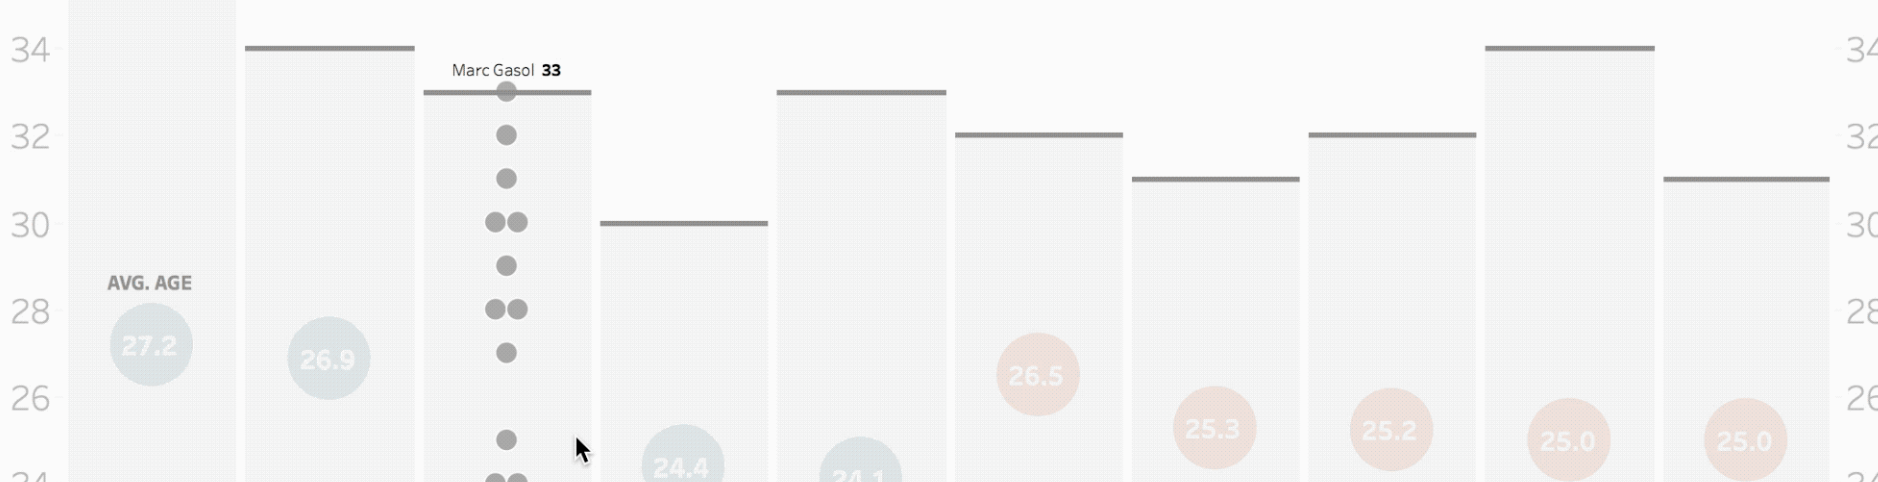
The What Set Actions can be used to allow for the ability to toggle between showing and hiding underlying data. Often times when showing a distribution or box plot, it makes the visual less cluttered to not be able to see the underlying points. However, it can be helpful to view the underlying data to […]
Author: Lindsey Poulter
The What Allow the end user to choose what they want to break down a dimension by. By clicking on a year, such as 2015, the user can decide if they want to see 2015 broken out by category, region, segment, or top 5 cities. The How Determine the main dimension to display as well […]
The What Set actions can be used to dynamically update reference lines and mark coloring upon clicking a point on a trend line. The Inspiration During the 2018 Tableau Conference Devs on Stage session, Set Actions and Parameter Actions were announced. The example for parameter actions involved looking at a trend line (by year) for each […]
Change Dimensions Using Set Actions
The What Set actions can be used to choose which dimension to use in corresponding visualizations. In this example, clicking on either “Category”, “Region”, or “Ship Mode” will break down the trend line and overall sales number. This approach allows for more flexibility in how a user chooses a dimension (this method can be applied […]
My Data Viz Journey
An Accounting Major Goes to a SEO Interview & Lands an Analytics Internship My journey to a career in data visualization began in April of 2014, when I, an accounting major, begrudgingly went to an interview for a SEO summer internship. I was a sophomore in college and too young to land an accounting internship. So, […]