Categories
Blog Tableau

3 Ways to Use Set Actions with Viz in Tooltips

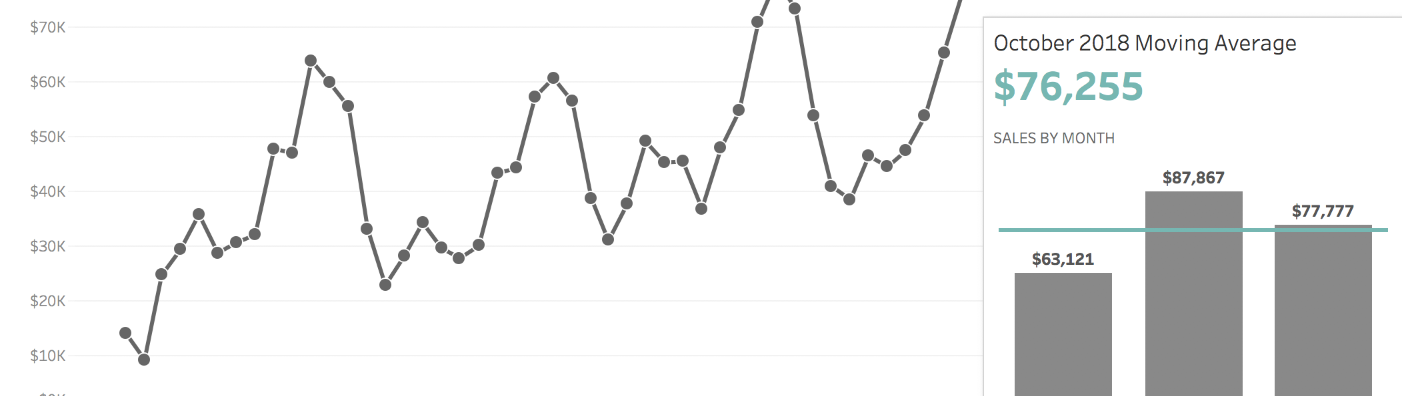
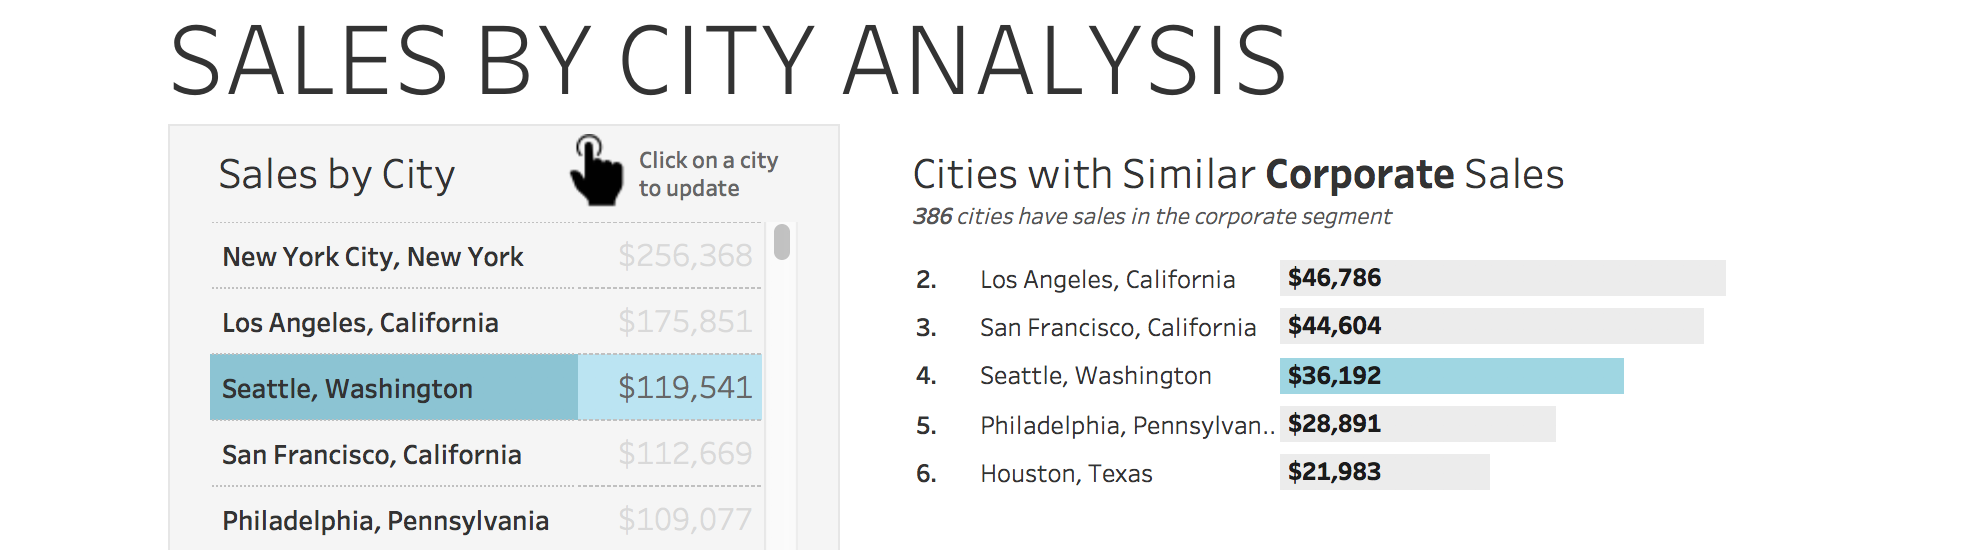
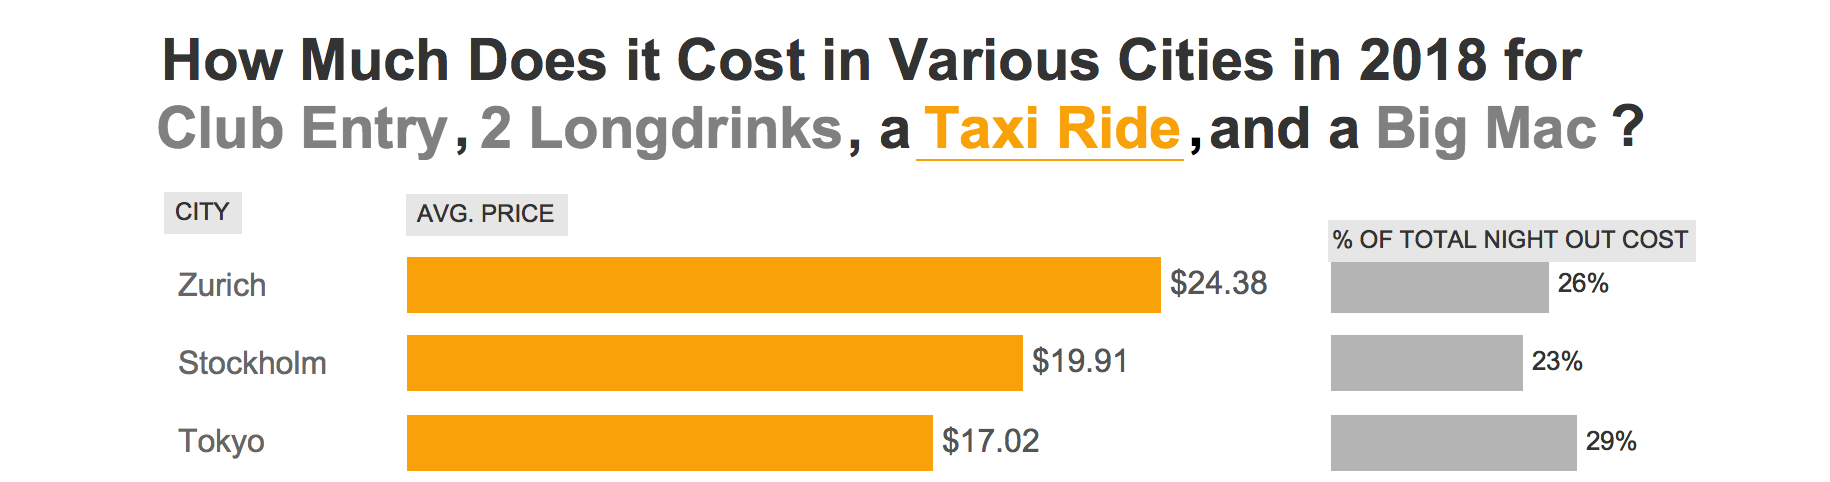
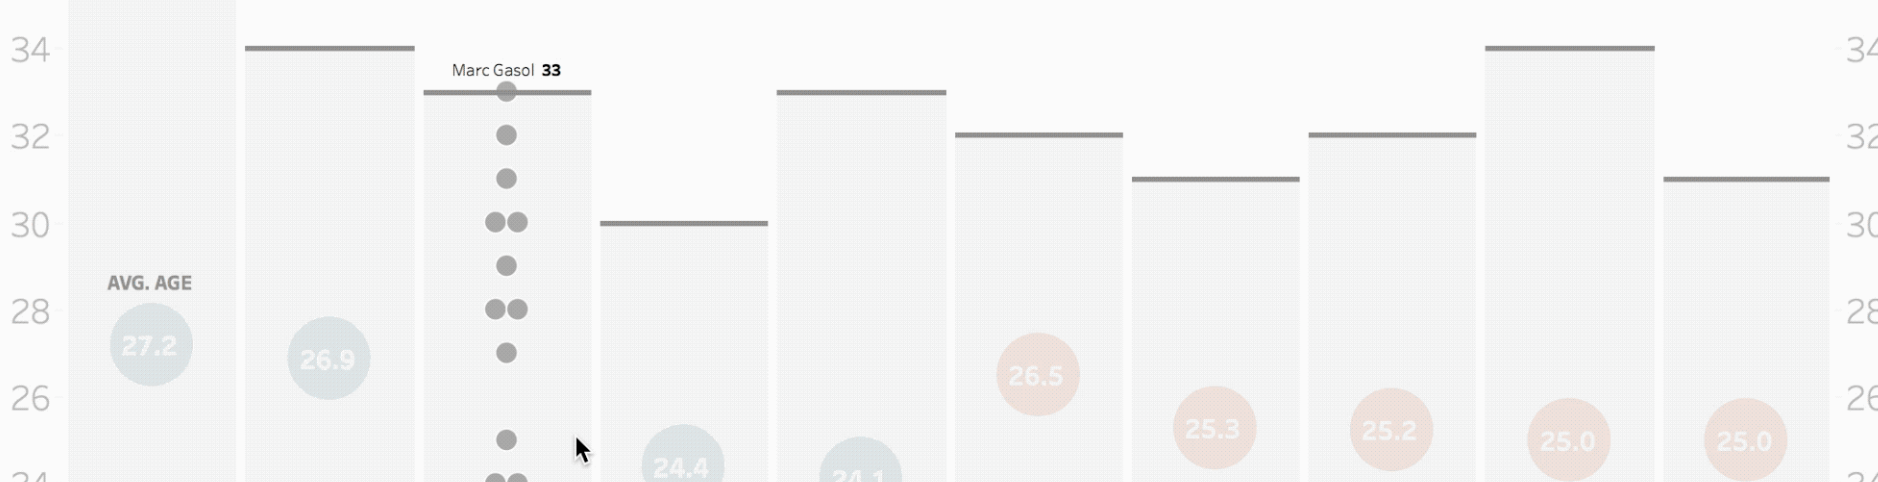
Viz in tooltips allow you to place entire worksheets inside the tooltip of another worksheet. This type of interactivity allows for additional information to be presented without taking up space on a dashboard (but be careful about placing important information in the tooltip, since you can’t be positive it will be seen). In the current […]

Categories
Blog Tableau

How I Created a Crossword Puzzle Using Set Actions

This week’s Makeover Monday looks at all the crossword puzzles created in the New York Times from 1993-2018 and breaks down how many of them were by women (with the caveat that 1993/2018 are partial years and puzzles where women collaborated are counted as by women). I almost passed on doing Makeover Monday this week, until […]

Categories
Blog Tableau

View Similarly Ranked Items Using Set Actions and Table Calcs

The What Set actions (along with table calculations) can be used to show dimension values that are similarly ranked to a selected dimension value. For example, selecting the city of Houston will show which 4 cities had sales, in the corporate segment, that were similar to Houston’s corporate segment sales. In this example, “similar” is defined […]

Categories
Blog

The David Beckham Effect

The November #SportsVizSunday challenge involved looking at MLS data, including attendance from 1996-2018. My initial thought was to create a visualization around my home team, Sporting Kansas City. I distinctly remember soccer being of very little relevance, the Wizards rebranding to SKC and getting a new stadium, and then soccer taking off in popularity around […]

Categories
Blog

Create Interactive, Filterable Titles in Tableau

The What Katherine Riley wrote a piece about replacing traditional legends with colored text in a title.  She also introduced a new featrure in Flourish that would make each piece added as a legend in the title have the option to be used as a filter. I am a big fan of setting up a visualization […]

Categories
Blog

Add Bar Charts into Drill Down Table with Set Actions

The What “We want our data in a table” is a sure way to make any data visualization practitioner cringe. Yet it is a common request by stakeholders in the business world. The main argument against displaying data in a table is the inability to quickly and accurately tell the difference between values, especially when […]

Categories
Blog

Create Custom Drop Lines Using Set Actions and Transparent Worksheets

The What Tableau Desktop includes a feature called drop lines that can be added to a graph (by right clicking on a mark and selecting drop lines > show drop lines). They then appear after clicking on any mark. There are some formatting options available, similar to reference lines. However, the biggest drawback to the […]

Categories
Blog

Use Icons to Add and Remove Values from a Set

The What Set actions allow the user to choose what is included and excluded from a set. Through the use of icons/shapes, the user can select what values they want to see as part of the set. Note: this method requires a worksheet (for the icon), a set, and a set action for every value […]

Categories
Blog

Use Set Actions to Show/Hide Underlying Data

The What Set Actions can be used to allow for the ability to toggle between showing and hiding underlying data. Often times when showing a distribution or box plot, it makes the visual less cluttered to not be able to see the underlying points. However, it can be helpful to view the underlying data to […]

Categories
Blog

Use Set Actions to Choose Which Dimension to Breakout By

The What Allow the end user to choose what they want to break down a dimension by. By clicking on a year, such as 2015, the user can decide if they want to see 2015 broken out by category, region, segment, or top 5 cities. The How Determine the main dimension to display as well […]